Data Layers

Back to Layers
Search Results
Legend
Aquaculture
Topic
Aquaculture
The Aquaculture topic displays datasets representing aquaculture activities in state waters and proposed aquaculture activities in federal waters. There are currently no permitted commercial aquaculture facilities in federal waters in New England. Under the Aquaculture topic, the Portal also displays maps of state shellfish management areas and managed shellfish beds.
Latest Updates
2026-03-23 Updated Aquaculture Data Directly from the States
2026-02-17 Proposed Commercial Blue Mussel Mariculture Facility
Data Providers and Sources
- Maine Department of Marine Resources; Office of Geographic Information Systems
- New Hampshire Department of Environmental Services
- Massachusetts Division of Marine Fisheries
- Rhode Island Department of Environmental Management Division of Marine Fisheries; Geographic Information System
- Connecticut Department of Agriculture, Bureau of Aquaculture; Department of Energy and Environmental Protection
- New York State Department of State; Department of Environmental Conservation
- US Army Corps of Engineers New England District
- US Food and Drug Administration National Shellfish Sanitation Program
- US Census
Data Considerations
The states have provided data representing aquaculture activities in state waters for display in the Portal. The data are developed and maintained by the states, meaning that when states update or revise their data, the Portal will automatically reflect those updates. State aquaculture data sources include:
- Maine Aquaculture Lease Sites and Maine Shellfish Growing Areas – provided by Maine Department of Marine Resources
- New Hampshire Shellfish Aquaculture – provided by Massachusetts Division of Marine Fisheries
- Massachusetts Designated Shellfish Growing Areas – provided by New Hampshire Department of Environmental Services, Fish & Game Department
- Rhode Island Aquaculture Lease Sites and Rhode Island Shellfishing Restriction Areas – provided by Rhode Island Department of Environmental Management Division of Marine Fisheries
- Connecticut Aquaculture Gear Areas, Connecticut Natural, Town, and State Shellfish Beds – provided by Connecticut Department of Agriculture, Bureau of Aquaculture
- New York Aquaculture Lease Sites, New York Shellfish Closures and Shellfish Conditional Programs – provided by New York State Department of State and New York Department of Environmental Conservation
The Portal also includes datasets depicting the footprint of proposed commercial aquaculture facilities in federal waters. Those data have been gleaned from permit applications submitted to the US Army Corps of Engineers by project proponents.
For an overview of aquaculture in the Greater Atlantic Region, including state and regional resources, and siting and permitting guidance, visit the NOAA Fisheries Aquaculture in New England and the Mid-Atlantic page.
Status
Aquaculture data and shellfish management areas data were reviewed in early 2026 and individual state data sources were integrated. Check the metadata associated with each individual state data source for detailed status information.
Examples of Data
- Proposed Newport Mussel Farm 2026
- New Hampshire Shellfish Aquaculture
- CT Shellfish Beds – Town Managed
National Security
Topic
National Security
National Security data show the extent and footprint of Department of Defense (DoD) activities and presence within the region, including areas for various surface and subsurface naval operations as well as pertinent infrastructure.
Data Providers and Sources
- US Navy
- NOAA Office for Coastal Management
Data Considerations
Data and metadata were provided by a contractor to the US Navy and are considered final and authoritative. These layers include military installations, warning areas, range complexes, submarine transit lanes, testing ranges, and other areas. The map also includes a layer for danger zones and restricted areas which is hosted externally by the National Oceanic and Atmospheric Administration (NOAA). Additional information is available by clicking on the layer name for each layer in the legend.
Status
Data were created in December 2015 and are final. These data will be updated as described in the 2016 Northeast Ocean Plan.
Examples of Data
- Danger Zones and Restricted Areas
- Military Installation Locations
- Naval Undersea Warfare Center Testing Range
- Cape Cod TORPEX
Energy & Infrastructure
Topic
Energy & Infrastructure
Energy & Infrastructure maps show the locations of proposed and existing energy facilities and transmission infrastructure areas at various stages of planning, review, permitting, and operation. Data shown on these maps are from authoritative sources such as the Bureau of Ocean Energy Management (BOEM), Federal Energy Regulatory Commission (FERC), the New England states, and marinecadastre.gov.
Subtopics: Infrastructure, Planning and Permitting
See also: Agency Actions > Offshore Wind Projects provides information about projects currently in each phase of the permitting process, including opportunities for public comment.
Data Providers and Sources
- Bureau of Ocean Energy Management
- Federal Energy Regulatory Commission
- Maine Aqua Ventus
- Maine Coastal Program
- Maine Department of Marine Resources
- Maine Governor’s Energy Office
- MarineCadastre.gov
- Massachusetts Office for Coastal Zone Management
- NOAA National Centers for Coastal Ocean Science
- NOAA Office for Coastal Management
- Rhode Island Coastal Resources Management Council
- Tetra Tech
- University of Maine
- University of Rhode Island
- US Army Corps of Engineers
Commercial Fishing
Topic
Commercial Fishing
Commercial Fishing includes a large amount of data on where and when different types of fishing occur, linkages between coastal communities and fishing areas, fishery management, and changes over time in commercial fishing activity. This topic encompasses five subtopics: Management Areas and Draft Alternative Management Areas depict the regulatory boundaries associated with fishing activities, whereas Vessel Activity, NOAA NEFSC Fishing Footprints, and Communities at Sea each take different approaches to representing fishing activity by leveraging different combinations of datasets (Vessel Monitoring System [VMS], Vessel Trip Reports [VTRs], vessel permit data, dealer report data) and methods (e.g., density mapping, modeling).
Latest Updates
13-Jun-2024: Commercial Fishing Footprints, Transit Density Data Now Online
4-Mar-2024: Southern New England Habitat Area of Particular Concern
Data Providers and Sources
- NOAA Greater Atlantic Regional Fisheries Office
- NOAA Northeast Fisheries Science Center
- Maine Department of Marine Resources
- Mid-Atlantic Ocean Data Portal
- RPS
- Rutgers University
Subtopic
Communities at Sea
Communities at Sea data show linkages between fishing communities and the fishing places that are most important to them. The maps are developed by linking Federal Vessel Trip Report (VTR) data (trip dates, gear type, number of crew on board, trip locations) with vessel permit data (vessel length, ports associated with each vessel).
The relative importance of fishing areas is measured in “fisherdays” based on the number of days that vessels spent fishing in any given area and the number of crew members that were aboard. Fisherdays do not reflect other variables such as number of pounds landed, value, or other common measures of fishing activity or effort; however, the map legends use the term “fishing effort” for simplicity. The maps can be interpreted as showing community presence in ocean areas. Two types of Communities at Sea maps are available:
- Regional maps show where fishing occurs with different gear types—bottom trawl, dredge, gillnet, longline, or pots and traps—and the relative importance of different places. The dataset includes vessels from all ports. For example, the places frequented by fishing vessels using bottom trawls or dredges can be visualized separately. Regional maps are shown by default or can be viewed by selecting All Ports in the Location dropdown menu.
- Port-specific maps indicate the most important places for fishing vessels associated with a selected port. The outline on the map represents where fishing vessels from that port conduct 90 percent of their fishing activity.For example, the places frequented by fishermen from New Bedford, Massachusetts, who fish using gillnets can be mapped separately from places frequented by gillnet fishermen from Portland, Maine. In addition, the places where New Bedford vessels fish with bottom trawls can be mapped separately from places that they fish with dredges. Port-specific maps can be viewed by selecting a port in the Location dropdown menu.
Note: Data on recreational fishing can be found in Culture & Recreation.
Data Considerations
Original VTR data were obtained from NOAA NMFS Northeast Fisheries Science Center, with methodology, data processing and cartography provided by staff at Rutgers University. For information about methodology and interpretation of the data, see Creating Space for Community in Marine Conservation and Management: Mapping ‘Communities at Sea’ by Kevin St. Martin (Rutgers) and Julia Olson (NOAA). To produce the Communities at Sea maps, all data were aggregated to the community level, and none of the maps represent the fishing areas, or hot spots, of any individual fisherman or fishing vessel. Draft maps were reviewed and refined in consultation with fishermen in several ports. The following considerations and caveats guided and emerged from those conversations:
- These maps represent the locations and intensity of fishing during particular time periods. If these maps are considered during planning or permitting decision-making processes, it is critical to recognize that additional important fishing areas may not be represented, as locations frequently shift due to many factors such as market dynamics, regulatory changes, and rotational fishing strategies.
- These maps only show fishing conducted by vessels holding federal fishing permits. The maps do show a portion of state-licensed activity because many state-licensed vessels engaged in ocean fishing also hold federal permits and therefore submit VTRs. State-licensed fishing activity includes whelks (“conch”), striped bass, black sea bass, and lobster.
- Maps showing areas for fishing with fixed gear (pots, traps, gillnets) will tend to be more accurate than maps showing fishing using mobile gear (trawls, dredges), and maps showing single-day trips will tend to be more accurate than maps showing multi-day trips. This is because of the nature of the fishing activity and record-keeping regulations; fishermen are only required to report one geographic position (point location) per trip on VTRs unless switching to a new gear type or moving into a new statistical area.
- These maps can be supplemented with maps based on Vessel Monitoring System data (available for select federally managed fisheries); see the Vessel Activity subtopic of Commercial Fishing. Overlaying and comparing the VTR-based maps with VMS-based maps reveals substantial agreement between the two, and the VMS maps provide additional useful precision for some fisheries.
- Fisheries and fisheries data are complex, and there are many options for mapping fishing activity, each with strengths and weaknesses. These maps are intended as a starting point to help target and guide direct engagement and consultation with specific affected fishing communities during diverse ocean planning, permitting, and management decision-making processes.
For some types of decision making (e.g, detailed construction plans for energy infrastructure) much finer-scale information and data than can be obtained using either VTR or VMS data will be needed, ideally provided by fishermen.
Status
Communities at Sea data products were developed using data from 1996-2015. The Northeast and Mid-Atlantic Data Portal teams are working on new ways to depict information from Vessel Trip Reports in spatial data products.
Examples of Data (Regional)
- Total Bottom Trawl < 65ft Activity 2011-2015
- Total Gillnet Activity 2006-2010
- Total Shrimp Activity 1996-2000
View Map: Examples of Data (Regional)
View Complete List of Data in Data Explorer
Examples of Data (By Port)
- CHATHAM, MA Longline Activity 2011-2015
- GLOUCESTER, MA Bottom Trawl <65 ft 2006-2010
- All Ports: Total Dredge Activity (2001-2005)
View Map: Examples of Data (By Port)
Subtopic
Vessel Activity
Vessel Activity data broadly characterize commercial fishing vessel activity in the Northeast based on Vessel Monitoring System (VMS) data from 2006 through 2019. The relative amount of vessel activity is indicated qualitatively from high (red) to low (blue). The National Marine Fisheries Service (NMFS) describes VMS as “a satellite surveillance system primarily used to monitor the location and movement of commercial fishing vessels in the U.S.” The maps do not necessarily distinguish between fishing activity, vessel transit, and other vessel activities. Some maps show vessel activity at less than four or five knots—a speed threshold that was determined with industry input to attempt to better highlight fishing areas. Nevertheless, those maps still likely show some non-fishing activities that occur at low speeds, such as processing catch, sorting, drifting, or idling in port. The most accurate interpretation of these maps is that they indicate relative levels of fishing vessel presence for federal fisheries that require VMS monitoring. The lack of historical data and relatively short timeframe of this map preclude consideration of historical fishing areas. It also does not illustrate more recent or future changes in fishing activity resulting from changing environmental and economic conditions, fisheries management, and other important factors.
Data Considerations
The limitations of the data used to produce these maps should be understood prior to interpretation of this map. The data provided by NMFS contained the day/month/year, the geographic coordinates of the vessel at the time of transmission, speed over ground, and the vessel’s declaration code, which signifies fishery plan, program within that plan, and associated area identifier or gear-type information. These data then were aggregated by combining all program codes within each fishery plan. VMS data is subject to strict confidentiality restrictions. Therefore, the map shows the density of vessel locations following the removal of individually identifiable vessel positions. The process of removing sensitive vessel locations followed the “rule of three” mandated by NMFS Office of Law Enforcement (OLE). The details of this filtering process vary between individual data products; see the metadata for each layer to see more detail on filtering processes used. A statistical method to normalize data was used on the subsequent density grids and data values represent standard deviations. While legends are consistent across products, values represent high or low areas of vessel activity specific to each dataset. This process can result in the maps showing vessel activity that seems anomalous, e.g. single data points in areas where multispecies fishing isn’t common, because three data points occur in a given 100m by 100m square. This is usually because of transit lines that overlap in a given cell while nearby cells contain less than three data points.
Status
Data through 2019 were updated and posted on Northeast Ocean Data in fall 2022, and they will continue to be updated as described in the 2016 Northeast Ocean Plan.
Examples of Data
- All VMS Vessels 2015-2019
View Complete List of Data in Data Explorer
Subtopic
NOAA NEFSC Fishing Footprints
NOAA NEFSC Fishing Footprints data depict areas of commercial fishing activity categorized by gear type, fishery (FMP), and time period and measured by landings or revenue. The data combine Vessel Trip Report (VTR) and dealer report data with modeling of probable fishing location using observer data.
Data Considerations
Data provided comply with data confidentiality requirements under the Magnuson-Stevens Act through aggregation. The data was summarized to show fishing activity in terms of pounds of fish landed (“landings”) or value (“revenue”) by Fishery Management Plan (FMP), species, fishing gear type, and time periods. Data was summarized on a 500 x 500-meter grid, showing activity within each grid cell. For more information on the Fishing Footprints methodology, please see DePiper G.S. 2014. Statistically assessing the precision of self-reported VTR fishing locations. NOAA technical memorandum NMFS-NE-229 and Benjamin S, Lee MY, DePiper G. 2018. Visualizing fishing data as rasters. NEFSC Ref Doc 18-12; 24 p.
Revenue and landings have been summarized for two time periods (2011-2015 and 2016-2020) for both FMP and gear type. The values represent annual averages over each five-year period. The data shown on the Northeast Ocean Data Portal has been filtered from the original data. Areas where revenue was less than $25 was excluded from both the revenue and corresponding landings data. Additionally, some of the “other” gear types with very little fishing activity were excluded from this set of data. Data are grouped into categories for time period, gear type/FMP, and revenue/landings.
Revenue and landings have been summarized for two time periods (2011-2015 and 2016-2020) for both FMP and gear type. The values represent annual averages over each five-year period. The data shown on the Northeast Ocean Data Portal has been filtered from the original data. Areas where revenue was less than $25 was excluded from both the revenue and corresponding landings data. Additionally, some of the “other” gear types with very little fishing activity were excluded from this set of data. Data are grouped into categories for time period, gear type/FMP, and revenue/landings.
It is important to note that these public datasets have suppressed certain information due to confidentiality concerns and are meant to present general patterns of commercial fishing activity. To obtain the most accurate estimates of fishing activity, particularly in the case of offshore wind development, please see the region’s socioeconomic impacts page or contact NMFS.GAR.Data.Requests@noaa.gov.
To view these and other fishing data related to offshore wind planning and leasing, please visit this web page: https://www.fisheries.noaa.gov/resource/data/socioeconomic-impacts-atlantic-offshore-wind-development.
Status
Data for 2011 to 2020 were added to the Portal in 2023.
Examples of Data
- Dredge – Scallop Landings 2016-2020
- Pot – Lobster Revenue 2016-2020
- Atlantic Herring Landings 2011-2015
Subtopic
Management Areas
Management Areas data show the boundaries of dozens of federal and state fishery management areas implemented for fisheries such as groundfish, lobster, sea scallop, and herring. Management areas data are organized by managed fishery.
Data Considerations
Management areas are regulatory boundaries that can change over time. Portal users should always consult the source/authority to verify the timeliness of the data prior to interpretation/use. For this same reason, Portal users should be careful to interpret ocean use/activity data that may correspond to times when different management areas were in effect. For example, the Atlantic scallop fishery is managed using a set of areas that rotate in terms of open/closed status every few years. Users should take care to interpret scallop fishery activity data with the management areas data that depict the management scheme in place during the applicable time. See “Expired Management Areas” for data depicting management areas that are no longer in effect but for which activity data may be present on the Portal.
Status
Data were reviewed for completeness and accuracy in 2023.
Examples of Data
- Groundfish Closure Areas
- Habitat Management Areas
- Maine DMR Lobster Zones
- North Atlantic Right Whale Seasonal Management Areas
- NEFMC Coral Protection Areas
- Sea Scallop Rotational Areas
Subtopic
Draft Alternative Management Areas
Draft Alternative Management Areas data show the preliminary boundary options that are under consideration when new fishery management areas are being proposed for the Northeast region.
Data Considerations
If no new boundaries relevant to ocean planning in the northeast are under consideration, this subtopic may be empty.
Status
New data and updates are posted as needed.
Example of Data
- An example of Draft Alternative Management Areas data on the Portal occurred during the process to identify a Southern New England Habitat Area of Particular Concern. That area was finalized in a rule published in February 2024.
Fish
Topic
Fish
Fish data provide information about fish species distribution, abundance, biomass, and habitat suitability in the northeast region. The data products within this topic are derived from state and federal surveys that have been repeated at regular intervals over time. This repetition has allowed NROC and its partners to develop maps that show shifts in species distribution over time using time-sliders and other tools. This topic also includes datasets that show the extents or footprints of some of the long-term surveys conducted by NOAA Fisheries, states, and other groups.
Latest Updates
10-Dec-2025: Updated and New Fish Abundance Data from Coastal Trawl Surveys
08-Jan-2025: Past and Future Habitat Suitability of Highly Migratory Species
Data Providers and Sources
- Marine Geospatial Ecology Lab, Duke University
- Marine life Data and Analysis Team (MDAT)
- NOAA Fisheries
- New England and Mid-Atlantic States
- New England Fishery Management Council
- Mid-Atlantic Fishery Management Council
- Northeast Area Monitoring and Assessment Program
- Fisheries & Climate Toolkit (FaCeT – NASA funding to Woods Hole Oceanographic Institution and San Diego State University)
Subtopic
Federal and Coastal Trawls by Species
This subtopic contains layers depicting the distributions of over 80 individual fish species based on their presence in repeated trawl surveys throughout the northeast region.
Federal trawl data come from the NOAA Northeast Fisheries Science Center, which has conducted the spring and bottom trawl survey since 1963. Federal trawl data products are bubble plots of raw observations and inverse-distance-weighted (IDW) surfaces at a 2km x 2km resolution for fall and spring survey data from 2010-2019 (records for fall 2017 were removed due to incomplete coverage of the survey area). All units are kilograms per tow. The IDW surfaces were developed using methods jointly developed by NOAA Fisheries and the Pinksy Lab at Rutgers University.
Coastal trawl data are provided by the Northeast Regional Habitat Assessment (NRHA), which is led and conducted by the New England Fishery Management Council and Mid-Atlantic Fishery Management Council with support from the NOAA Fisheries Office of Habitat Conservation and Office of Science and Technology. NRHA products in the Portal include summaries of abundance from 2010-2019 for approximately a dozen common coastal species derived from several coastal trawl datasets contributed by states and others. Hexagons are used to summarize abundance across the study area (Maine to Florida).
Data Considerations
Each set of fish trawl data sources has used standardized survey designs and data collection methodologies, but some have used different vessels and gears over time. Results have been normalized to account for these vessel and gear differences within each data source. These data products are based on observed data, not model predictions, for the selected time period.
For more detail about the mapping approaches and methodologies for the NEFSC (Federal) data products, including information about vessels, gear types, and species catchability, see the MDAT Technical Report on the Methods and Development of Marine-life Data. The raw data used to develop these data products are available in the NOAA InPort System: Bottom Trawl Surveys. Similar data products for additional time periods for the NEFSC bottom trawl survey and federal bottom trawl surveys in other U.S. regions can be explored via NOAA’s Distribution Mapping and Analysis Portal (DisMAP). DisMAP also includes visualizations of fish biomass change over time and a number of other distribution metrics.
Users interested in additional detail about the NRHA (Coastal Trawls) data should visit the NRHA Data Explorer. The NRHA Data Explorer includes maps, graphs, visualizations, and model outputs for many more individual species, as well as trawl survey metadata and other fish species information. The NRHA Data Explorer is a data viewer for trawl surveys. The data are not available for download. Datasets displayed on this site in summary format have associated caveats related to the collection of these data and their use. Please refer to the NRHA Reports page for additional details on each dataset, including contact information to obtain the source data. NRHA did not create the data and cannot guarantee its accuracy, or its suitability for use for other applications. NRHA encourages proper use and attribution of any datasets summarized on this site. Interested parties should directly contact the data providers noted in the NRHA metadata inventory for additional details on these data and their proper use.
Portal maps represent one set of many available sources of information, and in many cases only show subsets of full datasets that inform our current understanding of fish species distribution and abundance in the Northeast region. Other sources of information on fish species that complement the data shown here include:
- NOAA’s Distribution Mapping and Analysis Portal (DisMAP),
- The Northeast Regional Habitat Assessment Data Explorer
- OceanAdapt, a collaboration between the Pinsky Lab of Rutgers University and the NOAA National Marine Fisheries Service to provide information about the impacts of changing climate and other factors on the distribution of marine life,
- fishery-dependent data, such as fisheries observer data, vessel trip reports, or vessel monitoring systems (VMS) data,
- federal- and state-based river herring monitoring,
- vessel trip reports for lobster fishing,
- dedicated federal/academic/industry surveys of sea scallops, and
- the Northeast fish and shellfish climate vulnerability assessment.
CITATION
Any use of the fish maps and data in this viewer should be accompanied by the following citations:
- Ribera, M., Pinsky, M., Richardson, D. 2019. Distribution and biomass data for fish species along the U.S. east coast from about Cape Hatteras north to Canadian waters, created by The Nature Conservancy for the Marine-life and Data Analysis Team. Online access: http://www.northeastoceandata.org
- Curtice C., J. Cleary, E. Shumchenia, and P.N. Halpin. 2019. Marine-life Data and Analysis Team (MDAT) Technical Report on the Methods and Development of Marine-life Data to Support Regional Ocean Planning and Management. Prepared on behalf of the Marine-life Data and Analysis Team (MDAT). Accessed at: http://seamap.env.duke.edu/models/MDAT/MDAT-Technical-Report.pdf.
- Marine-life Data Analysis Team (MDAT; Patrick Halpin, Earvin Balderama, Jesse Cleary, Corrie Curtice, Michael Fogarty, Brian Kinlan, Charles Perretti, Marta Ribera, Jason Roberts, Emily Shumchenia, Arliss Winship). Marine life summary data products for Northeast ocean planning. Version 3.0. Northeast Ocean Data. http://northeastoceandata.org. Accessed MM/DD/YYYY.
ACKNOWLEDGMENTS
SOURCE: Northeast Fisheries Science Center (NEFSC) Ecosystems Dynamics and Assessment Branch and The Nature Conservancy (TNC). Data sourced from fall and spring 2010-2019 bottom trawl surveys performed by NEFSC Ecosystem Surveys Branch. These products represent the results of aggregating and interpolating trawl point data along the US east coast from North Carolina to Maine.
SOURCE: Northeast Regional Habitat Assessment (NRHA). People with questions about the NRHA Data Explorer and its various products may contact one of the following team members: Jessica Coakley, Mid-Atlantic Fishery Management Council, jcoakley@mafmc.org; Michelle Bachman, New England Fishery Management Council, mbachman@nefmc.org; Christopher Haak, Monmouth University/NOAA Fisheries, chrishaak@monmouth.edu; Tori Kentner, Mid-Atlantic Fishery Management Council, tkentner@mafmc.org; Laurel Smith, Northeast Fisheries Science Center, laurel.smith@noaa.gov.
Status
Federal and Coastal Trawl data products represent observations between 2010-2019.
Examples of Data
- American lobster, interpolated biomass, spring 2010-2019 (NEFSC Federal)
- American lobster, spring relative abundance (NRHA Coastal)
Subtopic
Archived Coastal Trawls Data
This subtopic contains layers depicting the distributions of over 80 individual fish species based on their presence in repeated trawl surveys throughout the northeast region from 2005-2014. (More recent datasets are contained in the Federal and Coastal Trawls by Species subtopic.)
Archived Coastal Trawl data were produced by the Marine life Data and Analysis Team (MDAT) and the Portal Working Group in collaboration with the NOAA Northeast Fisheries Science Center, Massachusetts Division of Marine Fisheries (MDMF), North East Area Monitoring and Assessment Program (NEAMAP), Maine & New Hampshire state trawls (ME/NH), and Connecticut Department of Energy and Environmental Protection Long Island Sound trawl (LIS).
For each of more than 80 species, the data products include bubble plots of raw observations and a 10km x 10km inverse-distance weighted interpolation plot which smoothed over multiple observations and interpolated in regions with few observations. All units are natural log kilograms per tow.
Data Considerations
These data are considered “archived” because they represent observed biomass from 1978-2014 and more recent fish distribution data are now available under Federal and Coastal Trawls by Species.
Each set of data sources have used standardized survey designs and data collection methodology, but some have used different vessels and gears over time. Results have been normalized to account for these vessel and gear differences. Fall survey samples were collected primarily from September to November, and spring survey samples were collected primarily from February to April. These data products are based on observed data, not model predictions, for the selected time period.
For more detail about the available time periods, mapping approaches, and other methodologies, including information about vessels, gear types, and species catchability, see the MDAT Technical Report on the Methods and Development of Marine-life Data.
For additional detail about individual state and coastal trawls, including the length of their full records and data availability, visit the Northeast Regional Habitat Assessment Data Explorer.
CITATION
Any use of the fish maps and data in this viewer should be accompanied by the following citations:
- MDMF, MENH, NEAMAP products: Fogarty, M., Perretti, C. 2016. Distribution and biomass data for fish species along the U.S. east coast from about Cape Hatteras north to waters in the state of Maine, created by the Northeast Fisheries Science Center for the Northeast Regional Ocean Council. Online access: http://www.northeastoceandata.org/dataexplorer/?fish
- LIS products: Gottschall, KF, and DJ Pacileo (2014) A study of recreational fisheries in Connecticut. State of Connecticut Department of Energy and Environmental Protection. http://www.ct.gov/deep/lib/deep/fishing/publications/2014_marine_fisheries_division_long_island_sound_trawl_survey.pdf
- Curtice C., J. Cleary, E. Shumchenia, and P.N. Halpin. 2019. Marine-life Data and Analysis Team (MDAT) Technical Report on the Methods and Development of Marine-life Data to Support Regional Ocean Planning and Management. Prepared on behalf of the Marine-life Data and Analysis Team (MDAT). Accessed at: http://seamap.env.duke.edu/models/MDAT/MDAT-Technical-Report.pdf.
- Marine-life Data Analysis Team (MDAT; Patrick Halpin, Earvin Balderama, Jesse Cleary, Corrie Curtice, Michael Fogarty, Brian Kinlan, Charles Perretti, Marta Ribera, Jason Roberts, Emily Shumchenia, Arliss Winship). Marine life summary data products for Northeast ocean planning. Version 3.0. Northeast Ocean Data. http://northeastoceandata.org. Accessed MM/DD/YYYY.
ACKNOWLEDGMENTS
SOURCE: Northeast Fisheries Science Center (NEFSC) Ecosystems Dynamics and Assessment Branch and The Nature Conservancy (TNC). Data sourced from Northeast Area Monitoring and Assessment Program (2007-2014), Massachusetts Division of Marine Fisheries (1978-2014), and the Maine Department of Marine Resources and New Hampshire Fish and Game Department (2000-2014). These products represent the results of aggregating and interpolating trawl point data along the US east coast from North Carolina to Maine.
SOURCE: Connecticut Department of Energy and Environmental Protection (CT DEEP), Marine Fisheries Division. Data sourced from fall (Sept–Oct) Long Island Sound Trawl Surveys (LISTS) conducted by CT DEEP (1992–2014). (1992–2014). For more information: P.O. Box 719, Old Lyme, CT 06371 United States; (860) 434-6043; deep.marine.fisheries@ct.gov.
Status
Archived Coastal Trawl data products represent observations between 1978-2014. They were originally added to the Portal in 2015 and were updated in 2021.
Examples of Data
- Atlantic cod interpolated natural log biomass, fall 2005-2014 (ME/NH)
- Atlantic cod, natural log biomass, fall 2005-2014 (MDMF)
Subtopic
Federal Trawl Summary Products
This subtopic contains Summary Products depicting the distributions of groups of fish species based on their presence in the spring and fall bottom trawl conducted by the NOAA Northeast Fisheries Science Center between 2010-2019. Species groups were developed through a partnership with the Marine life Data and Analysis Team (MDAT) and fall into several categories:
- Ecological (Diadromous, Forage, Demersal)
- Managed Species (NEFMC multispecies, NEFMC small mesh multispecies, NEFMC skates)
- Stressor Groups (Abundance vulnerable to climate changes, Distribution vulnerable to climate changes, Potentially vulnerable to EMF)
For each of these species groups, users can view biomass and species richness summarized for 2010-2019. Also within this subtopic are Historical Summary Products for all of the species groups listed above. Users can view spring and fall biomass Summary Products by decade between 1980 and 2019.
Data Considerations
Federal Trawl Summary Products provide a general overview of the total biomass or number of species (richness) for groups of species that are similar because of the way they are managed, their ecology, or their sensitivity to specific stressors. The Northeast Regional Ocean Council’s Marine Life Work Groups, stakeholders, the Ecosystem Based Management Work Group, and similar proceedings in the Mid-Atlantic region helped determine what Species Groups should be mapped and what species should belong to each group.
Species Group products can help answer questions such as:
- Where do the highest number of managed species overlap? (Species of Concern)
- Where are demersal fish most abundant? (Ecological Group)
- Where are fish that are potentially vulnerable to EMF most abundant? (Stressor Group)
Species Group products show annual averages of species patterns, they group as many as 81 species together on a single map, and they do not have specific associated estimates of uncertainty. For these reasons, Species Group products are a good starting point for further detailed analyses and exploration of the Individual Species products on which they are based.
To address specific questions, users should explore Individual Species map products. The entire marine life virtual reference library contains extremely detailed spatial and temporal information, including several measures of uncertainty to supplement each individual species map. These data are well suited to address specific questions in conjunction with site-specific data, scientific literature, public input, and many other information sources. For more details about mapping approaches, specific methods, caveats, and limitations, see the Marine-life Data and Analysis Team Model Repository.
CITATION
This work represents the efforts of many individuals and funders. Use of these map products for spatial planning purposes is encouraged, with appropriate citations included in any reports or publications.
For all maps and data in this topic please cite:
- Marine-life Data Analysis Team (MDAT; Patrick Halpin, Jesse Cleary, Corrie Curtice, Deborah Brill, Michael Fogarty, Brian Kinlan, Charles Perretti, Marta Ribera, Jason Roberts, Emily Shumchenia, Arliss Winship). Marine life summary data products for Northeast ocean planning. Northeast Ocean Data. https://northeastoceandata.org. Accessed MM/DD/YYYY.
- Curtice C., J. Cleary, E. Shumchenia, and P.N. Halpin. 2019. Marine-life Data and Analysis Team (MDAT) Technical Report on the Methods and Development of Marine-life Data to Support Regional Ocean Planning and Management. Prepared on behalf of the Marine-life Data and Analysis Team (MDAT). Accessed at: http://seamap.env.duke.edu/models/MDAT/MDAT-Technical-Report.pdf.
- Ribera, M., Pinsky, M., Richardson, D. 2021. Distribution and biomass data for fish species along the U.S. east coast from about Cape Hatteras north to Canadian waters, created by The Nature Conservancy for the Marine-life and Data Analysis Team. Online access: http://www.northeastoceandata.org/data-explorer/?fish
Status
Federal Trawl Summary Products mostly represent observations between 2010-2019, and some products show observations between 1980-2019.
Examples of Data
- Demersal biomass, fall 2010-2019, NEFSC
- Demersal species richness, fall 2010-2019, NEFSC
Subtopic
Highly Migratory Species Habitat Suitability – Past and Future
These data products were developed as part of the NASA-funded Fisheries and Climate Toolkit (FaCeT, https://fisheriesclimatetoolkit.sdsu.edu). FaCeT is a set of products to visualize and explore how climate change will impact highly migratory marine species and fisheries, bridging the gap between fisheries and climate science to support climate resilient and sustainable fisheries.
Data Considerations
Past and future habitat suitability for highly migratory species are modeled data products that leverage several input datasets. Species occurrence was represented using two fishery-dependent datasets: a tag database from the International Commission for the Conservation of Atlantic Tunas Secretariat and catch data from the at-sea observer program that monitors the U.S. Atlantic pelagic longline fishery. Several oceanographic data and models were used as potential predictor variables in the species distribution models. All of the oceanographic datasets were plotted, coarsened, or interpolated to match a grid with a ~9km horizontal resolution. Data were derived from the Global Ocean Physics Reanalysis (GLORYS) for observed oceanographic conditions (1993-2019) and Regional Ocean Model System (ROMS) simulations of the Northwest Atlantic ocean for future oceanographic conditions (2070-2099):
- Monthly sea surface temperature, degC
- Monthly sea surface height (meters)
- Monthly sea surface salinity (PSU)
- Bathymetry (meters) – from ETOPO1
- Rugosity (meters) – from ETOPO1
Full details for data processing and quality control can be found in Braun et al., 2023a and implementation of those methods for climate-scale projections is detailed in Braun et al., 2023b.
Status
These data products are final and were added to the Portal in 2025.
Examples of Data
- Bluefin Tuna Habitat Suitability, 1990, 2000, 2010, 2070, 2080, 2090
- Swordfish Habitat Suitability, 1990, 2000, 2010, 2070, 2080, 2090
Sea Turtles
Topic
Sea Turtles
Sea Turtles data provide information about sea turtle density by species, density of tagged loggerhead sea turtles, and federally designated critical habitat for loggerhead turtles.
Subtopics: Loggerhead Turtles, Sea Turtle Density by Species
Latest Updates
14-Sep-2023 Added new sea turtle surface density model data products including monthly estimates of average density and model coefficient of variation for four species: green, Kemp’s ridley, loggerhead, and leatherback
Birds
Topic
Birds
Birds data provide information about bird species density; density and species richness of all birds, spatial groups, ecological groups, species of concern, and stressor groups; bird movement; and bird habitat. The data products in this topic are modeled predictions by the Marine-life Data and Analysis Team (MDAT) based on data provided by many sources.
Subtopics: Bird Relative Density by Species, Bird Summary Products, Movement Information, Bird Habitat
Latest Updates
04-Apr-2024: Updated Marine Bird Distribution Models for U.S. Atlantic Waters Added to the Marine Life Library
Plankton
Topic
Plankton
The Plankton topic displays data products and composites related to proxies for phytoplankton presence, zooplankton, and ichthyoplankton abundance and estimated biomass (displacement volume). Under the Plankton topic, the Portal also displays locations where plankton monitoring has occurred and locations where plankton sampling is planned.
Subtopics: Phytoplankton, Zooplankton, Icthyoplankton, Plankton Monitoring
Latest Updates
01 May 2026: Hundreds of New and Updated Plankton Datasets
21 May 2025: Updates to Zooplankton Products from NOAA Fisheries EcoMon Surveys
Data Providers and Sources
- Marine-life Data & Analysis Team (MDAT)
- Moderate-resolution Imaging Spectro-radiometer (MODIS)
- National Aeronautics and Space Administration (NASA)
- Visible Infrared Imaging Radiometer Suite (VIIRS)
- Ocean-Colour Climate Change Initiative (OC-CCI)
- NOAA Northeast Fisheries Science Center (NEFSC)
- National Centers for Environmental Information (NCEI)
Data Considerations
The plankton data products available on the Portal have been developed by the Marine-life Data and Analysis Team (MDAT) in collaboration with NOAA Fisheries and other regional partners and compiled by the Marine Geospatial Ecology Lab at Duke University, drawing from satellite remote sensing and in situ survey collections. These datasets are hosted outside the Portal, meaning that as new data become available, the Portal will be updated to reflect the most current information. Plankton data sources include:
- Median Chlorophyll-a MODIS (2010–2019) – derived from remote sensing data from the Moderate-resolution Imaging Spectro-radiometer (MODIS) sensor onboard the Aqua satellite, provided by the National Aeronautics and Space Administration (NASA).
- Median Chlorophyll-a VIIRS (2020–2024) – derived from remote sensing data from the Visible Infrared Imaging Radiometer Suite (VIIRS) sensor onboard the NOAA-20 and Suomi-NPP satellites, provided by the National Oceanic and Atmospheric Administration (NOAA).
- Median Chlorophyll-a Composite (2020–2024) – derived from the Ocean-Colour Climate Change Initiative (OC-CCI) composite dataset, which synthesizes remote sensing data from multiple sensors.
- Zooplankton Abundance (2003–2009 & 2010–2021) – derived from data collected by the NOAA Northeast Fisheries Science Center Ecosystem Monitoring (EcoMon) survey and abundance rasters were created using methods developed by The Nature Conservancy in 2016.
- Ichthyoplankton Abundance (2003–2009 & 2010–2021) – derived from data collected by the NOAA Northeast Fisheries Science Center Ecosystem Monitoring (EcoMon) survey.
- EcoMon Sampling Points – companion layers showing sampling locations for zooplankton and ichthyoplankton by time period and season, providing context for variability in sampling effort (EcoMon Data Access)
Status
Plankton data were reviewed in early 2026. Check the metadata associated with each layer for detailed status and source of information.
Examples of Data
- Median Chlorophyll-a Composite (2020-2024)
- EcoMon Zooplankton Sample Points
- Atlantic Cod (Ichthyoplankton)
- Calanus finmarchicus
Seagrass & Tidal Marsh
Topic
Seagrass & Tidal Marsh
Seagrass & Tidal Marsh data provide information about the location and extent of coastal wetlands and seagrass meadows, and quantification of marsh and seagrass soil properties and biogeochemistry.
Latest Updates
07-Apr-2026 New and Updated Regional Seagrass Data
30-Mar-2024 New High-resolution Maps of Northeast U.S. Salt Marsh Carbon and Soil Properties
Data Providers and Sources
- Natural Resources Conservation Service (NRCS)
- U.S. Environmental Protection Agency (EPA) – Region 1 (EPA R1)
- National Aquatic Resource Surveys (National Wetland Condition Assessment)
- U.S. Fish and Wildlife Service (USFWS) – National Wetlands Inventory (NWI)
- U.S. Geological Survey (USGS)
- National Oceanic and Atmospheric Administration (NOAA) – Office for Coastal Management
- North Atlantic Landscape Conservation Cooperative (NALCC)
- Conservation Management Institute at Virginia Tech (contracted by NALCC)
- University of Massachusetts Amherst
- Saltmarsh Habitat and Avian Research Program (SHARP)
- University of New Hampshire (UNH) – Geospatial Science Center
- University of Rhode Island (URI) – Environmental Data Center (EDC)
- Bates College
- Virginia Tech – Conservation Management Institute
- Maine Department of Marine Resources, Bureau of Resource Management
- Maine Department of Environmental Protection (DEP)
- New Hampshire Department of Environmental Services (DES)
- Massachusetts Department of Environmental Protection (MassDEP)
- Massachusetts Division of Marine Fisheries (DMF)
- Rhode Island Coastal Resources Management Council (CRMC)
- Connecticut Department of Energy and Environmental Protection (CT DEEP)
- New York Department of Environmental Conservation (NYSDEC) – Seagrass Management Program, Natural Heritage Program, Peconic Estuary Partnership
- Piscataqua Region Estuary Partnership
- Long Island Sound Partnership / Long Island Sound Study
- Long Island South Shore Estuary Reserve Program
- Narragansett Bay National Estuarine Research Reserve (NBNERR)
- Rhode Island Eelgrass Task Force
Data Considerations
The Portal displays regional datasets related to seagrass and tidal marsh. However, data within these habitats are also routinely collected at fine spatial and temporal scales. Each state/program uses a different habitat survey frequency (see layer “Seagrass Survey Areas” for more information, for example) and suite of methods. These details are important for users seeking information about the precise location/extent/condition of particular seagrass meadows or particular marshes. Users should contact the relevant entity in that geographic area to obtain more detailed or more recent data, important context about how the data were collected, and other contextual information known by these experts.
To assist Portal users in finding the relevant experts that may know more about coastal vegetation habitats and trends in the northeast, the NROC Coastal Vegetation Workgroup has assembled the following list of groups throughout New England that actively map, assess, and study seagrass and tidal marsh habitats.
Seagrass Resources
The East Coast SAV Collaborative’s mission is to bring together experts in SAV research and management from each of the U.S. East Coast states from NC to ME to share ideas and information, provide training and resources, and collaborate on efforts that bring actionable science to the forefront of our SAV management strategies. Contact: eastcoastsavcollaborative@gmail.com
Northeast Regional Eelgrass Restoration Collaborative
A collaborative of scientists and managers from government, NGOS, community, and academic organizations with the aim to design an experimental and climate ready regional restoration and management strategy for eelgrass. Contact: Phil Colarusso
Maine
Massachusetts
Rhode Island
- RI Eelgrass Mapping Taskforce: A consortium of estuarine scientists that work collectively to map and monitor eelgrass coastal Rhode Island waters; a collaborative led by:
-
Narragansett Bay Estuary Program SAV Working Group
- Facilitate cross-state collaboration and coordination specifically for Tier 1 aerial photography mapping and workshops. Advise management agencies of the latest research, providing outreach on specific topics and advocacy when necessary.
- Contact: Courtney Schmidt
- RIGIS Eelgrass Locations (polygons)
Connecticut
- CT Eelgrass Working Group: Convened by the Connecticut General Assembly, Environment Committee in response to Connecticut General Assembly Special Act No. 23-7, introduced in House Bill No. 6480, approved June 26, 2023. The charge to the group was to “develop strategies for the preservation, restoration and expansion of eel grass along the state’s shoreline.”
- CT DEEP eelgrass data
Long Island Sound
- Long Island Sound Eelgrass Collaborative: Formed in 2023 to implement elements of the 2022 Eelgrass Management and Restoration Strategy (Long Island Sound Study, 2022)
- LIS Partnership Eelgrass Strategy
- Eelgrass extent data
New York
- New York’s Seagrass Protection Act (N.Y. Envtl. Conserv. Law §§ 13-0701 to 13-0705)
- NYDEC Seagrass Management
- The most updated data on seagrass distribution within several of New York’s estuary programs (including the Long Island Sound Study, Peconic Estuary Program, and the South Shore Estuary Reserve) has been summarized in one map available here: New York seagrass habitat.
Tidal Marsh Resources
A network of over 140 state, federal, tribal, nonprofit, and university scientists and coastal land managers that span Massachusetts, with partners from New Hampshire, Maine, and Rhode Island. Co-led by the Massachusetts Office of Coastal Zone Management and the University of Massachusetts, Amherst, Gloucester Marine Station, the SMWG is one of five Mass ECAN (Ecosystem Climate Adaptation Network) Work Groups.
Maine
New Hampshire
- New Hampshire Salt Marsh Plan: Great Bay NERR and NH Dept of Fish & Game with implementation by the New Hampshire Salt Marsh Task Force
- NH Salt Marsh Plan data viewer
- NH salt marsh habitat data (2013)
- NH salt marsh habitat data (2023) [In progress]
Massachusetts
- MassDEP Wetlands Program
- Interagency Coastal Wetlands Climate Resilience Workgroup (MassDEP Wetlands Program, MassCZM, Mass Fish & Game, MEPA Office, MA Executive Office of Energy and Environmental Affairs)
- MassGIS NWI
- MA Sea Level Affecting Marshes Model (SLAMM)
- Geospatial Characterization of Salt Marshes for Massachusetts
- Waquoit Bay National Estuarine Research Reserve
Rhode Island
Connecticut
Long Island Sound
- Long Island Sound Partnership – Salt Marsh Monitoring and Analysis Network
- LIS SLAMM
- USGS Coastal wetlands data for Long Island Sound
New York
- NYDEC Tidal Wetlands
- Regulatory tidal wetlands data
- NYDEC Environmental Resource Mapper references NWI data for marshes
Status
Seagrass Meadows, Seagrass Survey Areas, and Historical Seagrass Extent data were updated in March 2026, but the majority of data in the regional layers reflect seagrass meadows as surveyed between 2019-2024.
Tidal Marsh Vegetation Classification data are derived from imagery collected between 2014-2015.
Blue carbon layers generally reflect carbon stocks in habitats mapped between 2010-2020.
NROC’s Coastal Vegetation Workgroup identifies new or updated data that will improve existing data products and data/information gaps that hinder understanding of important habitats and limit decision making. They advance data development or data collection for those defined gaps, discuss research, assessments, and models that are being advanced by any of the member participants, and integrate relevant research and information into the Northeast Ocean Data Portal.
Examples of Data
- Seagrass Meadows
- Tidal Marsh Vegetation Classification
- Blue Carbon Stocks (MgC) – Eelgrass Meadows
- Blue Carbon Stocks (MgC) – Tidal Marsh
- Northeast Salt Marsh Soil Organic Matter (percent)
Bathymetry & Seafloor
Topic
Bathymetry & Seafloor
Bathymetry & Seafloor datasets relate to the shape, composition, biological activity, and depth below the sea surface of the seafloor. Bathymetry and seafloor data are used for navigational safety and charting, scientific research, and ocean planning. Data collected for navigational safety purposes must adhere to a specific set of standards and QA/QC procedures, whereas data collected for science and planning may not need to meet such rigorous criteria. Users should consult the metadata for each data product to understand intended uses. The data products within this topic are derived from many individual state, federal, and private sources. Within Bathymetry & Seafloor, Portal users can explore several subtopics.
Latest Updates
2026-05-26: NROC Habitat Classification and Ocean Mapping Subcommittee’s Seafloor Mapping Prioritization
2025-04-09: Public Comment Opportunity: New England Shelf Hydrogeology Expedition
2025-03-27: New and Updated Seafloor Datasets
2025-01-10: New Coastal Resilience & Sand Category and Datasets
Data Providers and Sources
- Maine
- New Hampshire
- Massachusetts
- Rhode Island
- Connecticut
- New York
- NOAA National Centers for Environmental Information (NCEI)
- NOAA Office of Coast Survey
- NOAA Office for Coastal Management
- NOAA National Centers for Coastal and Ocean Science (NCCOS)
- NROC Habitat Classification & Ocean Mapping Subcommittee (HCOM)
- New England Fishery Management Council
- USGS
- UMass School of Marine Science & Technology
- University of New Hampshire
- INSPIRE Environmental
Subtopic
Benthic Communities
Benthic community data products visualize organisms’ presence on, within, or near the seafloor. These communities include deep sea corals and sponges, sea stars, snails, and sand dollars, for example. Data products in this subtopic include models and average abundances over many years.
Data Considerations
Benthic community data are relatively effort-intense to collect. Benthic communities can be characterized by collecting physical samples and via seafloor imagery (i.e., photos and video). Users should consult the metadata for each data product to obtain data provider contact information, methodological detail, and to understand intended uses.
Status
The data products and sources within this topic were reviewed by the NROC Habitat Classification and Ocean Mapping Subcommittee in 2025.
Examples of Data
- Deep-sea Soft Coral Habitat Suitability
- Seastar Average Abundance
Subtopic
Bathymetry Products
Bathymetry data products are processed and mosaicked bathymetry data. From the sources within this topic, data can be viewed/obtained for individual bathymetry survey patches and as aggregated regional scale products.
Federal sources of bathymetry data include:
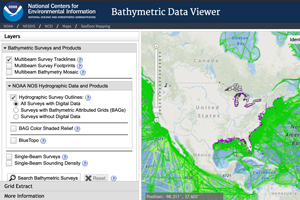
The Portal layer “NCEI – Surveys with Digital Sounding Data” shows multibeam survey footprints and provide download links from this source, which includes all of the bathymetry data archived at NCEI. Also available but not shown in the Portal are multibeam survey tracklines, singlebeam surveys, hydrographic surveys, crowdsourced bathymetry surveys, digital elevation models, and coastal lidar datasets.
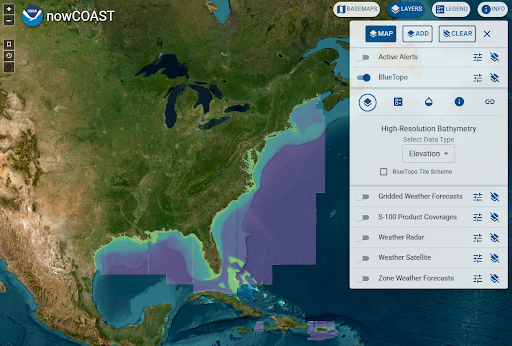
Office of Coast Survey BlueTopo
The Portal layers “BlueTopo” and “BlueTopo Tile Scheme” show a compilation of the nation’s best bathymetry data. BlueTopo provides consistently formatted bathymetry for the entire Atlantic coast along with metadata and several data quality metrics for each input survey/tile. BlueTopo is updated on a weekly to monthly basis according to regional rates of coastal change and availability of new sources data. The data in BlueTopo come from the NCEI bathymetry data archive.
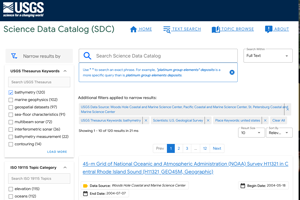
Bathymetry data collected by the USGS are archived in the Science Data Catalog. Some of the bathymetry composites listed below under “Other sources” include USGS data.
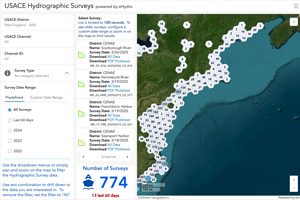
U.S. Army Corps of Engineers Hydrographic Surveys
This tool allows the download of hydrographic survey data that have been processed an uploaded by U.S. Army Corps of Engineers Districts.
Other sources of bathymetry data:
Regional Seafloor Data Repository
NROC and the Mid-Atlantic Regional Council on the Ocean (MARCO) support a Regional Seafloor Data Repository which includes uploads of bathymetry data from a variety of providers on the U.S. east coast who want to make their data available for research and ocean planning purposes.
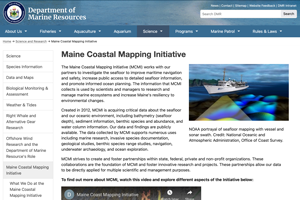
Maine Coastal Mapping Initiative
The Maine Coastal Program’s Mapping Initiative (MCMI) works with its partners to investigate the seafloor to improve maritime navigation and safety, increase public access to detailed seafloor information, and promote informed ocean planning.
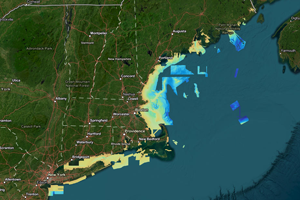
The Portal layers “Northeast region bathymetry composite” are composites of multiple datasets collected by federal, state, and private entities, provided at 4-meter and 16-meter resolutions.
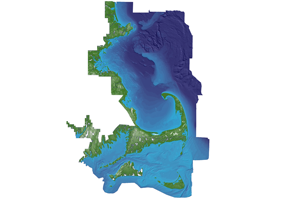
Continuous Bathymetry and Elevation Models of the Massachusetts Coastal Zone and Continental Shelf
Integrated terrain models covering 16,357 square kilometers of the Massachusetts coastal zone and offshore waters were built to provide a continuous elevation and bathymetry terrain model for ocean planning purposes.
Continuous Topographic/Bathymetric Digital Elevation Model for the State of Rhode Island
This work sought to compile the best-available elevation and bathymetry data for the state, then construct a new, continuous topographic/bathymetric digital elevation model (DEM).
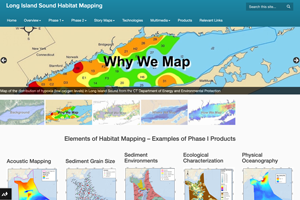
Long Island Sound Habitat Mapping Initiative
This web site provides information on the background and motivation for the mapping initiative, updates on the field activities conducted to date, interpretive story maps describing some of the results to date, and multimedia links to images and video of the beauty and complexity of the Sound.
Data Considerations
Bathymetry data shown on the Portal may be intentionally visualized at lower resolution than the highest resolution available for a variety of reasons (e.g., to ensure reasonable map loading time, to obscure the precise locations of certain sensitive seafloor features. Users should consult the metadata for each data product to obtain data provider contact information, methodological detail, and to understand intended uses.
Status
The data products and sources within this topic were reviewed by the NROC Habitat Classification and Ocean Mapping Subcommittee in 2025.
Examples of Data
- Bathymetric Contours
- Northeast Region Bathymetry Composite, 16m
- Global Bathymetry/Topography
Subtopic
Ongoing and Planned Surveys
Partners across sectors are actively mapping parts of the seafloor in the northeast U.S. for a variety of reasons. The topic provides information about ongoing and planned seafloor surveys from entities that share this information with NROC or make it available publicly.
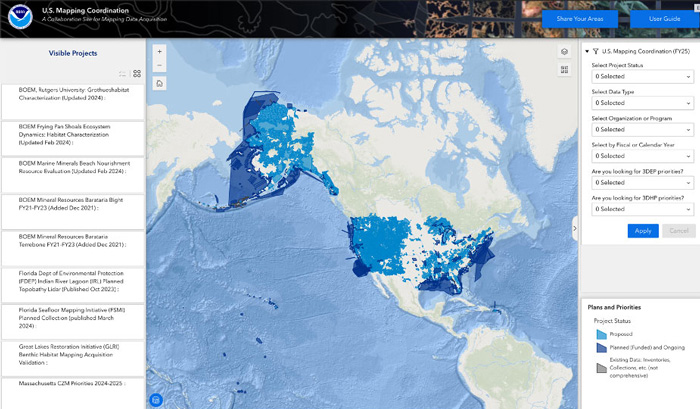
The NROC Habitat Classification and Ocean Mapping Subcommittee (HCOM) coordinates to determine and update seafloor mapping needs in the region with the intent to acquire high-quality, regional seafloor mapping products for ongoing and emerging management challenges. NROC recently introduced a revised process for expanding outreach and regularly updating regional seafloor mapping priorities using a Survey123 tool. With this tool, HCOM’s goal is to create a more consistent seafloor mapping prioritization map for New England informed by additional participants and updated as mapping occurs within the region. More information and instructions for submitting priorities.

At the national scale, the Interagency Working Group on Ocean and Coastal Mapping (IWG-OCM) and the 3D Elevation Program (3DEP) are collaborating to coordinate mapping efforts across organizations from federal to local, academic, and private levels with the goal of facilitating collaboration between agencies to optimize mapping data acquisition, avoid redundancy, and ensure data meets multiple needs. A public coordination site includes tools to view and submit mapping requirements, priority areas, and preliminary acquisition plans for various data types including acoustic surveys, lidar, and digital imagery. For more information, contact iwgocm.staff@noaa.gov.
Data Considerations
Users should consult the metadata for each data product to obtain data provider contact information, methodological detail, and to understand intended uses.
Status
The data within this subtopic are continually updated. The data products and sources within this topic were reviewed by the NROC Habitat Classification and Ocean Mapping Subcommittee in 2025.
Examples of Data
- Planned NOAA Hydrographic Survey Areas (3-year outlook)
- Maine Seafloor Mapping Priorities 2024-2025
Subtopic
Seafloor Features & Geoforms
Seafloor features and geoforms data products are usually derived from some combination of bathymetry data and “ground-truthing” data (e.g., sediment samples, images of the seafloor). The Coastal and Marine Ecological Classification Standard (CMECS) is a structured catalog of ecological terms that also provides a framework for interpreting, classifying, and inter-relating observational data from all types of sensors and platforms. CMECS Geoform units describe the major geomorphic and structural characteristics of the coast and seafloor.
Data Considerations
The quality and accuracy of seafloor features and geoforms data products depends heavily on the quality of the input data. Users should consult the metadata for each data product to obtain data provider contact information, methodological detail, and to understand intended uses.
Many types of seafloor features and geoforms are static on long time scales (e.g., rocky zone), whereas some (e.g., sediment wave field) may be dynamic on much shorter time scales. Broadly, the extent of seafloor features and geoforms are thought to be mostly stable on decadal time scales. However, the exact extent and location of these features today may differ slight than those shown in the Portal.
Status
The data products and sources within this topic were reviewed by the NROC Habitat Classification and Ocean Mapping Subcommittee in 2025.
Examples of Data
- Seascapes – CMECS Geoform Category 1
- TNC NAMERA Seabed Forms
- Submarine Canyons
Subtopic
Sediment Products
Sediment data products represent the surficial composition of the seafloor, usually expressed as “grain size” or a classification of grain size (e.g., “sandy mud”). The Coastal and Marine Ecological Classification Standard (CMECS) is a structured catalog of ecological terms that also provides a framework for interpreting, classifying, and inter-relating observational data from all types of sensors and platforms. CMECS Substrate units describe the character and composition of surface and near-surface substrates.
Sediment data are collected by federal, state, and private entities. Some databases of sediment in the northeast U.S. include descriptions that are 200 years old.
The sediment data products in the Portal include point datasets of individual sediment observations as well as continuous models or maps of sediment types that are built using the sediment observations as one of many potential inputs.
Data Considerations
The quality and accuracy of sediment data and data products depends heavily on the age, collection method, and in the case of continuous models – the modeling methods and quality of the input data. Users should consult the metadata for each data product to obtain data provider contact information, methodological detail, and to understand intended uses.
Some seafloor environments in the northeast U.S. are more stable than others. Users can overlay data products that estimate sediment stability (Sediment stability, N m-2 (SMAST)) to understand how to potentially interpret a map of sediment types for a particular location.
Status
The data products and sources within this topic were reviewed by the NROC Habitat Classification and Ocean Mapping Subcommittee in 2025.
Examples of Data
- usSEABED Atlantic Coast Offshore Surficial Sediment
- TNC NAMERA Soft Sediments
- Southeast New England Regional Sediment
Subtopic
Fishing Effects
The datasets in this subtopic constitute the sediment data inputs and primary outputs from the Northeast Fishing Effects Model (Fishing Effects). Fishing Effects estimates the impacts of fishing with bottom-tending gears on seabed habitats throughout the Northeast region in both state and federal waters within the U.S. EEZ. Habitat impacts vary in space and time according to fishing gear type, the magnitude of fishing effort in each grid cell, and the types of geological and biological habitat structures inferred to each grid cell. These habitat structures are inferred based on substrate type and natural energy at a particular location. The types of structures assumed to occur in each grid cell influence the estimated susceptibility of the habitat to fishing and the estimated recovery times following impact.
The Fishing Effects model is based on the Swept Area Seabed Impact (SASI) model (NEFMC 2011) and a model developed by the North Pacific Fishery Management Council (Fujioka 2006). The SASI vulnerability assessment was published in 2014 by Grabowski et al. Fishing Effects is also used in the North Pacific region (Smeltz et al. 2019), and Fishing Effects Northeast was developed in collaboration with the developers of Fishing Effects North Pacific. The Fishing Effects Model was developed collaboratively by the New England Fishery Management Council’s Habitat Plan Development Team and the Fisheries, Aquatic Science, and Technology Laboratory at Alaska Pacific University.
Data Considerations
The primary purpose of the sediment maps is to serve as a base layer for the Fishing Effects model. Five different sediment grain sizes plus a steep and deep habitat type are represented in the dataset, which indicates the proportion of each grain size occurring within each 5×5 km grid cell based on available data (primarily from the USGS and SMAST drop camera survey dataset).
The Portal shows monthly model outputs for the 3 most recent years available (2015, 2016, 2017). The Fishing Effects model generated monthly data for 1996-2017.
Positional accuracy may vary according to positioning methodology in the underlying data sources. Note that Vessel Trip Reports often represent each fishing trip by a single latitude/longitude. Results are aggregated by Fishing Effects Model grid cell, with each cell having a resolution of 5×5 km.
The products are based on sediment samples collected between 1934 and 2018 and fishing activity occurring between 1996 and 2017.
There is no formally established threshold percentage indicating severe or significant vulnerability in a management context. In considering how these model outputs relate to real-world fishing activity, it is important to recognize that while fishing is distributed broadly across the Northeast-shelf region, activity with specific gear types is typically concentrated spatially. The percent disturbance results can be contrasted with the intrinsic vulnerability results to get a sense of the difference between the expected effects from moderate, uniform levels of fishing as compared to the percentages of disturbance that result from real-world concentrations of effort. Because the Fishing Effects model allows for recovery from disturbance, the percent disturbance will eventually trend toward zero in the absence of fishing effort, and locations with no effort from a particular gear type (fishery closure areas, or locations where that gear is simply not used) will show no disturbance associated with that gear.
Users should consult the metadata for data provider contact information, a detailed description of the Fishing Effects methods, and to understand intended uses.
Status
Fishing Effects Northeast was last updated in 2019, and another update is planned as part of the New England Council’s 2025 EFH Review.
Examples of Data
- Percent Sediment Type – Mud
- Percent Seabed Habitat Disturbance, All Gear Types (2015), Monthly
- Intrinsic Seabed Habitat Vulnerability To Fishing – Bottom Trawl, Median Fishing Effort
Coastal Resilience and Sand
Topic
Coastal Resilience & Sand
Coastal Resilience & Sand provides data relevant to increasing coastal communities’ capacity to prepare for and recover from hazards such as storm waves and inundation. The Sand & Sediment Management subtopic has data on locations where sand or other sediment may be present, disposed of, or used for beneficial purposes such as beach nourishment. The Water Levels subtopic includes data from the North Atlantic Coast Comprehensive Study (NACCS), a two-year initiative of the US Army Corps of Engineers to help address coastal storm and flood risk. Data for a new subtopic on Living Shorelines is being developed by NROC for future release.
Subtopics: Sand & Sediment Management, Water Levels
Latest Update
10-Jan-2025: New Coastal Resilience & Sand Category and Datasets
Data Providers and Sources
- NOAA Office for Coastal Management
- Northeast Regional Ocean Council
- RPS
- US Army Corps of Engineers
- US Department of Interior
Subtopic
Sand & Sediment Management
Data within this subtopic are provided by federal agencies with jurisdiction over activities taking place on the seafloor in U.S. federal waters. Agencies and data include the U.S. Army Corps of Engineers (Beneficial Use Sites, National Channel Framework, National Sediment Management Framework, Ocean Disposal Sites – with NOAA and EPA), and the Bureau of Ocean Energy Management (Sand Resources, Marine Minerals Shore Study Areas).
Data Considerations
Many of the datasets in this subtopic are also included in the Marine Transportation > Navigation subtopic in the Portal, because they may describe navigational features and/or hazards. The Portal shows a particular visualization, or in some cases, a subset of the full datasets maintained by the agencies on these features. Users should consult these additional resources for more detail and information:
- U.S. Army Corps of Engineers New England District Beneficial Use Planning Tool
- U.S. Army Corps of Engineers Regional Sediment Management Platform
- U.S. Army Corps of Engineers Disposal Area Monitoring System (DAMOS)
- BOEM Marine Minerals Information System (MMIS)
Status
Data from the U.S. Army Corps of Engineers (Beneficial Use Sites, National Channel Framework, National Sediment Management Framework, Ocean Disposal Sites) are updated frequently and the maps on the Portal represent the most recent versions from the agency. Other datasets are updated less frequently but were reviewed by the Portal Working Group in 2025.
Examples of Data
- Atlantic OCS Aliquots with Sand Resources
- Beneficial Use Sites
- BOEM MMIS Sand Resources
- National Sediment Management Framework Borrow Areas and Placement Areas
Subtopic
Water Levels
The Water Levels subtopic currently includes layers derived from the North Atlantic Coast Comprehensive Study (NACCS), which was a two-year initiative of the US Army Corps of Engineers to help address coastal storm and flood risk to vulnerable populations, systems, and infrastructure affected by Hurricane Sandy (2012). The data are intended to support coastal resilience initiatives by providing actionable information on coastal flood risk to the planning and management communities.
Data Considerations
NACCS data are modeled outputs. At each data point, storm surge and significant wave height was computed for a combined set of 1,150 storm events (1,050 synthetic tropical storms and 100 historical extratropical storms) using the coupled ADCIRC/STWAVE models. Users should refer to the full North Atlantic Coast Comprehensive Study Report for more details about the modeling methodology, limitations, and interpretation/use of outputs.
Status
The NACCS study and data are final as of 2015. The NACCS data are modeled outputs that are not representative of a particular time period. Additional data related to water levels throughout the region are currently being developed by NROC for future release.
Examples of Data
- NACCS 100-year Return Period Water Levels
- NACCS 100-year Return Period Wave Heights
Ocean Conditions & Water Quality
Topic
Ocean Conditions & Water Quality
Ocean Conditions & Water Quality data provide information about oceanographic characteristics such as currents, wind speeds, and temperatures, as well as factors related to ocean and coastal water quality such as wastewater facilities and water quality assessment areas.
Subtopics: mCDR Projects, Conditions
See also: Agency Actions > mCDR Research Permits provides information about EPA permitting of marine carbon dioxide removal (mCDR) activities, including opportunities for public comment.
Latest Updates
22-Jan-2025 Status update and public comment opportunity for tentative permit for the LOC-NESS Project research study
20-Jun-2024 Added study locations for a proposed mCDR research study
08-Sep-2022 Added NOAA Wastewater Outfalls data showing locations of publicly owned treatment works and other significant point source discharges
Data Providers and Sources
- Coastal Data Information Program (CDIP)
- Mid-Atlantic Regional Association of Coastal Ocean Observing Systems (MARACOOS)
- National Renewable Energy Laboratory (NREL)
- NOAA Center for Operational Oceanographic Products and Services (CO-OPS)
- NOAA National Data Buoy Center (NDBC)
- NOAA National Estuarine Research Reserves System (NERRS)
- Northeastern Regional Association of Coastal Ocean Observing Systems (NERACOOS)
- RPS Applied Science Associates (RPS ASA)
- University of Massachusetts-Dartmouth School for Marine Science and Technology (SMAST)
- US Environmental Protection Agency (EPA)
- US Geological Survey (USGS)
- USDA Natural Resources Conservation Service (NRCS)
- Woods Hole Oceanographic Institution (WHOI)
Marine Transportation
Topic
Marine Transportation
Marine Transportation data and maps are developed and reviewed with robust input from data providers, stakeholders, and experts including mariners, fishermen, port authorities, pilots, and industry representatives. Data in the Marine Transportation topic are organized into three subtopics: Navigation, Commercial Traffic, and Proposed Areas and Studies. New annual and monthly data on Commercial Traffic are added in the first quarter each year, when they become available for the prior year. Data for the other two subtopics are added, updated, and/or removed on an ongoing basis.
Subtopics: Navigation, Commercial Traffic, Proposed Areas and Studies
See also: Agency Actions > Coast Guard Proposed Actions provides information about proposed rules, Port Access Route Studies (PARS), and other actions relevant to marine transportation, including public comment opportunities.
Latest Updates
26-Sep-2025: Coastal Buoy Modernization Proposal Update
16-Sep-2025: New 2024 Vessel Traffic Data, Maps, and Tools
29-Apr-2025: Coast Guard First District Coastal Buoy Modernization Initiative Proposal
Data Providers and Sources
- Marine Cadastre
- National Oceanic and Atmospheric Administration
- North American Submarine Cable Association
- US Army Corps of Engineers
- US Coast Guard
- US Department of Transportation
Subtopic
Navigation
Navigation data products shows boundaries of designated and identified marine transportation areas for commercial and recreational vessels in the region.
Data Considerations
Many of the features on the Navigation map are officially designated and actively maintained by the U.S. Coast Guard or the U.S. Navy, and their locations are well established. Examples include anchorages; maintained channels; safety, security, and regulated zones; danger zones and restricted areas; and boundaries of the Mandatory Ship Reporting System. Some of the pilot boarding areas on the map are not designated by federal or state government authorities. However, they are well known and considered important by the maritime commerce sector.
Examples of Data
- Traffic Lanes
- Danger Zones Restricted Areas
Subtopic
Commercial Traffic
This map series shows the vessel transit counts or relative density of large commercial cargo, tanker, tug-tow, passenger, fishing, recreation, other, or all vessels in 2011-2013 and 2015-2024. These maps are based on data received from Automatic Identification Systems (AIS). Maps generally show the annual vessel activity; for select years and vessel types, maps also show monthly activity.
Data Considerations
Not all vessels are equipped with AIS, nor are all vessels required to carry and operate an AIS. AIS utilizes radio frequency transmissions, and therefore the effective range at which a vessel can be detected can vary widely based on atmospheric conditions and equipment configuration. For these maps, vessel tracks were derived from raw AIS data provided by the U.S. Coast Guard. The vessel tracklines were used to generate transit counts or density values to convey patterns of vessel activity by vessel type.
The datasets may contain errors in vessel categorization. For example, some vessel operators did not report their vessel type or reported the wrong category by mistake, and some vessels are used for multiple purposes but are included in only one AIS category (e.g., a boat categorized as a pleasure craft that also operates as a fishing vessel). In addition, while every effort is made to ensure data quality, occasional errors can occur in processing these data.
Example of Data
- 2024 Cargo Vessel Transit Counts
- 2024 Passenger Vessel Transit Counts
- 2024 Tug-Tow Vessel Transit Counts
- 2024 Fishing Vessel Transit Counts
Subtopic
Proposed Areas & Studies
These map layers show boundaries of US Coast Guard Port Access Route Studies (PARS) and proposed fairways and other routing measures based on PARS. For information about PARS, including Federal Register notices and opportunities for public comment, refer to the Portal’s Coast Guard Proposed Actions page.
Examples of Data
- USCG Approaches to Maine, New Hampshire, and Massachusetts Port Access Route Study (MNMPARS) Recommended Fairways
- USCG MNMPARS Study Area
Marine Mammals
Topic
Marine Mammals
Marine Mammals data provide information about marine mammal species distribution, abundance, and density as determined from scientific surveys offshore and strandings onshore, as well as data products representing marine mammal habitat. The data products within this topic are derived from many individual state, federal, and private sources. In addition to North Atlantic Right Whale Critical Habitat, Portal users can explore three subtopics.
Data Providers and Sources
- Marine Geospatial Ecology Lab, Duke University
- Marine life Data and Analysis Team (MDAT)
- NOAA Greater Atlantic Region Fisheries Office
- NOAA Northeast Fisheries Science Center
- NOAA Southeast Fisheries Science Center
- Atlantic Marine Conservation Society
- Fish and Wildlife Research Institute of the Florida Fish and Wildlife Conservation Commission
- HDR Incorporated, Marine Conservation Research
- New England Aquarium
- New Jersey Department of Environmental Protection
- New York State Department of Environmental Conservation
- TetraTech, Incorporated
- University of North Carolina, Wilmington
- Virginia Aquarium & Marine Science Center
- Wildlife Trust / EcoHealth Alliance / Sea to Shore Alliance
Subtopic
Marine Mammal Density by Species
This subtopic contains layers depicting the monthly distributions of 31 individual marine mammal species or guilds based on their presence in structured scientific surveys in the Atlantic Ocean. Layers represent predicted densities for each month considering surveys conducted and environmental conditions observed between 1992 and 2020.
Models for individual marine mammal species and guilds were developed by the Marine Geospatial Ecology Lab (MGEL) at Duke University through a partnership with the Marine-life Data and Analysis Team (MDAT) and a collaboration with the Northeast Regional Ocean Council and expert work groups. MGEL worked with marine mammal biologists and ecologists at the NOAA Northeast and Southeast Fisheries Science Centers and several other research institutions to create habitat-based density surface models for cetaceans occurring off the US East Coast. The results of this work have been published in Roberts et al. (2016), with updates documented in Roberts et al. (2023).
Data Considerations
Some of the MDAT maps contain information about federally protected species. Additional information about the distribution, abundance, and range of species listed under the Marine Mammal Protection Act, the Endangered Species Act, the Migratory Bird Treaty Act, and the Magnuson-Stevens Fishery Conservation and Management Act is available at:
- NOAA Fisheries Office of Protected Resources
- NOAA Fisheries Greater Atlantic Region Protected Resources Division
- NOAA Fisheries Office of Habitat Conservation
- NOAA Fisheries Greater Atlantic Region Habitat Conservation Division
Details about each individual model can be found on the MGEL Seamap Model Repository page, along with some animations and answers to frequently asked questions. The MDAT Technical Report on the Methods and Development of Marine-life Data summarizes additional aspects of the models that may be important to users of Northeast Ocean Data. These maps represent one set of many available sources of information that inform our current understanding of species distribution and abundance in the Northeast region. Other sources of information on marine mammal species that complement the data shown here include:
- the Atlantic Marine Assessment Program for Protected Species (AMAPPS) and AMAPPS Marine Mammal Model viewer,
- datasets that display sightings-per-unit-effort, such as those held in the North Atlantic Right Whale Consortium sightings database,
- NOAA CetMap Biologically Important Areas for cetaceans, and
- the Passive Acoustic Cetacean Map.
CITATION
Any use of the marine mammal maps and data in this viewer should be accompanied by the following citations:
- Roberts J.J., B.D. Best, L. Mannocci, E. Fujioka, P.N. Halpin, D.L. Palka, L.P. Garrison, K.D. Mullin, T.V.N. Cole, C.B. Khan, W.M. McLellan, D.A. Pabst, and G.G. Lockhart. 2016. Habitat-based cetacean density models for the U.S. Atlantic and Gulf of Mexico. Scientific Reports 6: 22615. doi: 10.1038/srep22615.
- Roberts JJ, Yack TM, Halpin PN (2023) Marine mammal density models for the U.S. NavyAtlantic Fleet Training and Testing (AFTT) study area for the Phase IV Navy Marine SpeciesDensity Database (NMSDD). Document version 1.3. Report prepared for Naval FacilitiesEngineering Systems Command, Atlantic by the Duke University Marine Geospatial EcologyLab, Durham, North Carolina. https://seamap.env.duke.edu/seamap-models-files/Duke/Reports/AFTT_Marine_Mammal_Density_Models_2022_v1.3.pdf
- Curtice C., J. Cleary, E. Shumchenia, and P.N. Halpin. 2019. Marine-life Data and Analysis Team (MDAT) Technical Report on the Methods and Development of Marine-life Data to Support Regional Ocean Planning and Management. Prepared on behalf of the Marine-life Data and Analysis Team (MDAT). Accessed at: http://seamap.env.duke.edu/models/MDAT/MDAT-Technical-Report.pdf.
- Marine-life Data Analysis Team (MDAT; Patrick Halpin, Earvin Balderama, Jesse Cleary, Corrie Curtice, Michael Fogarty, Brian Kinlan, Charles Perretti, Marta Ribera, Jason Roberts, Emily Shumchenia, Arliss Winship). Marine life summary data products for Northeast ocean planning. Version 3.0. Northeast Ocean Data. http://northeastoceandata.org. Accessed MM/DD/YYYY.
ACKNOWLEDGMENTS
SOURCE: Marine Geospatial Ecology Lab (MGEL) at Duke University. This product was developed by MGEL in collaboration with colleagues at the National Oceanic and Atmospheric Administration (NOAA) National Marine Fisheries Service (NMFS), the University of North Carolina, Wilmington (UNCW), the Virginia Aquarium & Marine Science Center (VAMSC), the Fish and Wildlife Research Institute (FWRI) of the Florida Fish and Wildlife Conservation Commission, and the Atlantic Marine Conservation Society. It was derived from habitat-based density models for cetaceans built from shipboard and aerial line transect surveys conducted at sea over more than two decades by the NMFS Northeast and Southeast Fisheries Science Centers, UNCW, VAMSC, the New Jersey Department of Environmental Protection, HDR Incorporated, Marine Conservation Research, FWRI, New England Aquarium, New York State Department of Environmental Conservation and TetraTech, Incorporated, and Wildlife Trust / EcoHealth Alliance / Sea to Shore Alliance. The UNCW surveys were funded by U.S. Navy Fleet Forces Command and NOAA. VAMSC surveys in Virginia were funded by the Virginia Coastal Zone Management Program at the Department of Environmental Quality through Task 1 of Grant NA12NOS4190027 and Task 95.02 of Grant NA13NOS4190135 from NOAA, under the Coastal Zone Management Act of 1972, as amended. The southeast U.S. right whale surveys were funded by NOAA, the U.S. Army Corps of Engineers, the U.S. Coast Guard, the U.S. Navy, the Georgia Department of Natural Resources, the South Carolina State Port Authority, and the National Fish and Wildlife Foundation. Funding for this project was provided by United States Fleet Forces Command and was managed on their behalf by Naval Facilities Engineering Systems Command Atlantic. Development of the model for North Atlantic right whale was co-funded by NOAA under a cooperative research agreement. The Northeast and Mid-Atlantic Regional Ocean Councils provided funding for summary product creation and data hosting services. For more information, please contact Jason Roberts (jason.roberts@duke.edu).
Status
These products were revised according to agency and public feedback and were posted on the Northeast Ocean Data Portal in August 2018 and May 2023.
Examples of Data
- Fin whale, average density January, predicted animals per 100 square kilometers
- Harbor porpoise, standard error January, predicted animals per 100 square kilometers
Subtopic
Marine Mammal Summary Products
This subtopic contains Summary Products depicting the total abundance and species richness of several different groups of marine mammals. It was built from the Marine life Data and Analysis Team (MDAT) Individual Species products (available in the Marine Mammal Density by Species subtopic) that characterize the predicted distribution and abundance of marine mammal species or species guilds. Species groups were developed through a partnership with MDAT and fall into several categories:
- All cetaceans
- Ecological groups (Baleen whales, Sperm and beaked whales, Small delphinoids, Large delphinoids)
- Species of concern (All ESA-listed species)
- Stressor groups (Low frequency sound sensitivity, High frequency sound sensitivity, Vulnerability to climate change, Sensitivity to climate related changes in abundance, ensitivity to climate related changes in distribution, Sensitivity to climate related changes in phenology)
For each of these species groups, users can view total abundance and species richness summarized for a typical annual period.
Data Considerations
Species Group products provide a general overview of the total abundance, biomass, or number of species (richness) for groups of species that are similar because of the way they are managed, their ecology, or their sensitivity to specific stressors. Experts convened by NROC and MARCO helped determine what Species Groups should be mapped and what species should belong to each group.
Species Group products can help answer questions such as:
- Where do the highest number of endangered whale species overlap? (Species of Concern)
- Where are small delphinoids most abundant? (Ecological Group)
- Where are mammals that are sensitive to low-frequency sound most abundant? (Stressor Group)
Species Group products show annual averages of species patterns, they group as many as 31 species and species guilds together on a single map, and they do not have specific associated estimates of uncertainty. For these reasons, Species Group products are a good starting point for further detailed analyses and exploration of the Individual Species products on which they are based.
To address specific questions, users should explore the Marine Mammal Density by Species subtopic. The entire marine life virtual reference library contains extremely detailed spatial and temporal information, including several measures of uncertainty to supplement each individual species map. These data are well suited to address specific questions in conjunction with site-specific data, scientific literature, public input, and many other information sources.
For more details about mapping approaches, specific methods, caveats, and limitations, see the Marine-life Data and Analysis Team Model Repository page.
CITATION
This work represents the efforts of many individuals and funders. Use of these map products for spatial planning purposes is encouraged, with appropriate citations included in any reports or publications.
For all maps and data on this page please cite:
- Marine-life Data Analysis Team (MDAT; Patrick Halpin, Jesse Cleary, Corrie Curtice, Deborah Brill, Michael Fogarty, Brian Kinlan, Charles Perretti, Marta Ribera, Jason Roberts, Emily Shumchenia, Arliss Winship). Marine life summary data products for Northeast ocean planning. Northeast Ocean Data. https://northeastoceandata.org. Accessed MM/DD/YYYY.
- Curtice C., J. Cleary, E. Shumchenia, and P.N. Halpin. 2019. Marine-life Data and Analysis Team (MDAT) Technical Report on the Methods and Development of Marine-life Data to Support Regional Ocean Planning and Management. Prepared on behalf of the Marine-life Data and Analysis Team (MDAT). Accessed at: http://seamap.env.duke.edu/models/MDAT/MDAT-Technical-Report.pdf.
- Curtice C., J. Cleary, E. Shumchenia, and P.N. Halpin. 2019. Marine-life Data and Analysis Team (MDAT) Technical Report on the Methods and Development of Marine-life Data to Support Regional Ocean Planning and Management. Prepared on behalf of the Marine-life Data and Analysis Team (MDAT). Accessed at: http://seamap.env.duke.edu/models/MDAT/MDAT-Technical-Report.pdf.
- Roberts J.J., B.D. Best, L. Mannocci, E. Fujioka, P.N. Halpin, D.L. Palka, L.P. Garrison, K.D. Mullin, T.V.N. Cole, C.B. Khan, W.M. McLellan, D.A. Pabst, and G.G. Lockhart. 2016. Habitat-based cetacean density models for the U.S. Atlantic and Gulf of Mexico. Scientific Reports 6: 22615. doi: 10.1038/srep22615.
- Roberts JJ, Yack TM, Halpin PN (2023) Marine mammal density models for the U.S. Navy Atlantic Fleet Training and Testing (AFTT) study area for the Phase IV Navy Marine Species Density Database (NMSDD). Document version 1.3. Report prepared for Naval Facilities Engineering Systems Command, Atlantic by the Duke University Marine Geospatial Ecology Lab, Durham, North Carolina.
ACKNOWLEDGMENTS
SOURCE: Marine Geospatial Ecology Lab (MGEL) at Duke University. This product was developed by MGEL in collaboration with colleagues at the National Oceanic and Atmospheric Administration (NOAA) National Marine Fisheries Service (NMFS), the University of North Carolina, Wilmington (UNCW), the Virginia Aquarium & Marine Science Center (VAMSC), the Fish and Wildlife Research Institute (FWRI) of the Florida Fish and Wildlife Conservation Commission, the Atlantic Marine Conservation Society, the Clearwater Marine Aquarium Research Institute, the Woods Hole Oceanographic Institute, the Massachusetts Clean Energy Center, the Bureau of Ocean Energy Management, the Maryland Dept. of Natural Resources, Tetra Tech and HDR. It was derived from habitat-based density models for cetaceans built from shipboard and aerial line transect surveys conducted at sea over more than two decades by the NMFS Northeast and Southeast Fisheries Science Centers, UNCW, VAMSC, the New Jersey Department of Environmental Protection, HDR Incorporated, Marine Conservation Research, FWRI, New England Aquarium, New York State Department of Environmental Conservation and TetraTech, Incorporated, and Wildlife Trust / EcoHealth Alliance / Sea to Shore Alliance. The UNCW surveys were funded by U.S. Navy Fleet Forces Command and NOAA. VAMSC surveys in Virginia were funded by the Virginia Coastal Zone Management Program at the Department of Environmental Quality through Task 1 of Grant NA12NOS4190027 and Task 95.02 of Grant NA13NOS4190135 from NOAA, under the Coastal Zone Management Act of 1972, as amended. The southeast U.S. right whale surveys were funded by NOAA, the U.S. Army Corps of Engineers, the U.S. Coast Guard, the U.S. Navy, the Georgia Department of Natural Resources, the South Carolina State Port Authority, and the National Fish and Wildlife Foundation. Funding for this project was provided by United States Fleet Forces Command and was managed on their behalf by Naval Facilities Engineering Systems Command Atlantic. Development of the model for North Atlantic right whale was co-funded by NOAA under a cooperative research agreement. The Northeast and Mid-Atlantic Regional Ocean Councils provided funding for summary product creation and data hosting services. For more information, please contact Jason Roberts (jason.roberts@duke.edu).
Status
MDAT marine mammal summary products were revised according to agency and public feedback and were posted on the Northeast Ocean Data Portal in May 2023.
Examples of Data
- Cetaceans: Total Abundance
- Cetaceans – All ESA listed: Species Richness
Subtopic
Marine Mammal Monitoring
This subtopic contains layers that show some of the locations of marine mammal monitoring activities offshore, like aerial survey transects and deployment locations of passive acoustic monitoring sensors.
Data Considerations
These data do not represent all marine mammal monitoring activities. For maps of several other kinds of marine mammal monitoring and data collection activities, visit the RWSC Research Planning Map.
Status
Marine Mammal Monitoring data are updated frequently, but the most up-to-date information can be found on the Research Planning Map.
Subtopic
Marine Mammal Strandings
This subtopic contains products developed from data provided by the NOAA Marine Mammal Health and Stranding Response Program from Maine to Virginia between 2000 and 2020.
Data are summarized several ways: by County, by Species Group, and by Season. Species Groups include North Atlantic Right Whales, Humpback Whales, Other Whales, Dolphins, Porpoises, Seals, and Unidentified.
Data Considerations
These data may contain errors or may be missing records. These data are a subset of information contained in the NOAA National Marine Mammal Health and Stranding Response Database. In some cases, further information on particular stranding events may be obtained by contacting the stranding network organization that responded. Please acknowledge the National Marine Mammal Stranding Network in any use of these data.
Status
Marine Mammal Strandings products represent observations between 2000-2020.
Examples of Data
- Marine Mammal Strandings: County Summaries (2000-2020)
- Strandings – Winter
Socioeconomics
Topic
Socioeconomics
Socioeconomics maps show human population in coastal towns, counties, and states, and data on ocean-related businesses, employment, and GDP in coastal counties.
Data Providers and Sources
- US Census Bureau
- Center for the Blue Economy
- Economics: National Ocean Watch
Status
Socioeconomic data are currently being updated and revised by the Portal team.
Examples of Data
- Total Population
Culture & Recreation
Topic
Culture & Recreation
Culture & Recreation data include the locations of select sites and areas on coastal lands and offshore that have cultural, historical, and/or recreational importance and may be relevant for ocean planning. One potential use of the data within the Culture & Recreation topic is to identify stakeholders that are using areas in the ocean for cultural and recreational purposes. In this way, the data within the Culture & Recreation topic can be viewed as a directory of groups and entities to contact prior to proposing a new or expanded ocean use in an area.
Latest Updates
30-Jun-2022: Added whale watching data for the mid-Atlantic region.
28-Apr-2021: Updated whale watching and SCUBA data in collaboration with local industry, stakeholders, and experts.
Data Providers and Sources
- Bronx River Alliance
- Connecticut Dept. of Energy and Environmental Protection
- Maine Dept. of Agriculture
- Maine Historic Preservation Commission
- Maine Island Trail Association
- Massachusetts Office of Fishing and Boating
- Massachusetts Historical Commission
- National Park Service
- New Hampshire Office of Energy and Planning
- New York State Office of Parks, Recreation and Historic Preservation
- NOAA National Marine Sanctuary Program
- NOAA Office of Coast Survey
- Point 97
- Reef Environmental Education Foundation
- Rhode Island Blueways
- Rhode Island Department of Environmental Management
- Rhode Island Geographic Information System
- Rhode Island Historic Preservation Office
- Rhode Island Sea Grant Program
- Rivers Alliance of Connecticut
- SeaPlan
- South Shore Blueway
- Surfrider
- The Nature Conservancy
- US EPA
Subtopic
Federally Managed Natural and Historical Areas
Data within this subtopic include sites and areas listed in the National Register of Historic Places, proposed and existing National Marine Sanctuaries, National Parks, and other federally managed lands. The National Register of Historic Places (NRHP) was established by the National Historic Preservation Act of 1966. The NRHP database is a listing of sites (e.g., buildings, objects) and areas (e.g., large properties, districts) that have cultural or historical significance and are noteworthy for preservation.
Data Considerations
The National Register of Historic Places dataset is a compilation from state databases. Currently the map shows NRHP locations only in Maine, Massachusetts, New York, and Rhode Island. NRHP data for New Hampshire and Connecticut are not shown on the map because spatial datasets for those states are currently being developed. The NRHP sites in this dataset are from individual state databases/sources. Some NRHP sites may be missing from this dataset. However, states are working on updating their databases/datasets, and this regional dataset will be updated as states provide updates. Users must consult with appropriate State and/or Tribal Preservation Offices in the identification and evaluation of historic properties as stated under the National Preservation Act. This regional dataset compiled by Northeast Ocean Data serves as a baseline for identifying NRHP; users must confirm with appropriate State and/or Tribal Preservation Offices for official listings under the National Register of Historic Places. For more information and current listings of NRHP, please be directed to the National Park Service’s National Register of Historic Places website.
Status
NRHP data were current as of 2015. Other datasets within this subtopic were reviewed in 2024 and 2025.
Examples of Data
- National Park Service Boundaries
- National Register of Historic Places: Sites and Landmarks
- National Register of Historic Places: Districts and Properties
- Stellwagen Bank National Marine Sanctuary
- Hudson Canyon Proposed National Marine Sanctuary Reference Area
- National Estuarine Research Reserve System
- USFWS National Realty Tracts
Subtopic
Tribes
This subtopic currently includes a layer that shows Federally Recognized Tribal Locations.
Status
The NROC Tribal Caucus will consider and review data within this subtopic.
Subtopic
Secured Lands
Data in this subtopic are a subset of The Nature Conservancy’s 2018 Secured Lands dataset (publicly downloadable external version), including State Forests, Lands, and Parks within ten kilometers of the coastline from Maine to New York. The complete version of the Secured Lands dataset is available at http://nature.ly/securedareas with a detailed report and additional information. The Secured Lands dataset shows public lands, private lands, and waters secured by a conservation situation that includes an explicit level of security from future conversion and current incompatible uses.
Data Considerations
The Nature Conservancy strives for its Secured Lands dataset to include all permanently protected lands in the eastern 18 U.S. states. The dataset is compiled annually from over sixty sources. For the most part, it is a combination of public land information maintained by each state, and private conservation land information compiled by The Nature Conservancy’s state field offices. Please see metadata for more information. Please be advised that not all sites found in The Nature Conservancy’s Secured Lands dataset and the dataset provided on the Northeast Ocean Data Portal are publicly accessible.
Status
Final dataset leverages a 2018 database from The Nature Conservancy; reviewed in 2025.
Examples of Data
- Parks and Reserves
Subtopic
Boating
The Boating map depicts activity areas mapped through two separate but related studies. Recreational Boating Density and Recreational Boater Routes result from the 2012 Northeast Recreational Boater Survey conducted by SeaPlan, the Northeast Regional Ocean Council (NROC), states’ coastal agencies, marine trade associations composed of many private industry representatives, and the U.S. Coast Guard First District. Distance Sailing Races were characterized as part of the Northeast Coastal and Marine Recreational Use Characterization Study which was conducted by SeaPlan, the Surfrider Foundation, and Point 97 under the direction of the Northeast Regional Planning Body.
Data Considerations
Both a random and a supplemental sample of Northeast boaters plotted their boating routes throughout the 2012 boating season using an online mapping application. The density map is derived using only the random sample of survey participants and is intended to show the relative density of boating activity throughout the region using a scale from high (red) to low (green). Areas showing low or no activity does not necessarily mean they are not used for recreational purposes. According to the results of the survey, these areas are likely less trafficked than other areas. Distance sailing race routes were mapped through a combination of online research, existing datasets such as the Rhode Island Ocean Special Area Management Plan (RI OSAMP), and industry expert data mapping and vetting. This dataset is believed to represent all known and believed-to-be recurring offshore distance sailing races in the region, as defined by the scope of this study. This study defined a distance sailing race as an offshore race starting at one port and ending in another, or an offshore race which begins at a port, has a turning point at a single location, and ends at the same port. This dataset is not intended to capture the spatial footprint of buoy races, which typically take place closer to shore and whose courses include sailing around courses comprised of buoys or other navigational markers. The lines depicting these races are highly generalized to reflect an approximate route between the start and end locations, based on course instructions, information from industry experts, and data from race tracking software. There can be a large spread of boat routes associated with any one race and these lines are meant to depict a general midpoint of activity and as such, this dataset is intended to be depicted at a regional scale. Actual sailing routes vary depending on winds and other environmental conditions, meaning that races depicted on a large (i.e., zoomed-in) scale may not provide a precise depiction of the actual race activity.
Status
These are final data products, representing the results from a 2012 recreational boater survey.
Examples of Data
- Recreational boating density
- Recreational boater routes
- Distance sailing races
Subtopic
Whale Watching
Whale watching layers depicts areas mapped by whale watch industry experts in 2020, using the Northeast Coastal and Marine Recreational Use Characterization Study (conducted in 2015 by SeaPlan, the Surfrider Foundation, and Point 97 under the direction of the Northeast Regional Planning Body) as a starting point. Whale watch owners, operators, naturalists, and data managers attended multiple webinars to review and discuss updates to the original data to best depict where whale watching takes place in the region, while also providing information about seasonality, species, and overall industry trends. Experts generally sought to depict whale watching activity in the last decade (2010-2020) by highlighting areas of general use, dominant use, supplemental areas, and transit routes. RI Ocean Special Area Management Plan areas were mapped as part of the Rhode Island Ocean Special Area Management plan and are symbolized separately to reflect different data collection methodologies.
Data Considerations
This map also shows the locations of whale watching entities in the region who have been invited to participate in data development and review. Clicking on the point locations will reveal the name of the entity, its location, and website URL. Users are encouraged to consult the metadata for additional details.
Status
These are final data products, representing the results of an expert working group in 2020.
Examples of Data
- Commercial Whale Watching Areas
- Whale Watching Locations
Subtopic
SCUBA
SCUBA diving data were collected through several methods which include outreach to the SCUBA diving community and mining existing data sources. Data were initially collected as part of the Northeast Coastal and Marine Recreational Use Characterization Study which was conducted by SeaPlan, the Surfrider Foundation, and Point 97 under the direction of the Northeast Regional Planning Body from 2014-2016. Additional dive site data from the REEF voluntary fish survey were added in 2021 and updated in 2023.
Data Considerations
This map depicts generally well-known SCUBA diving areas, such as wrecks, artificial reefs, and other marine habitats, as mapped by SCUBA diving experts and locations identified in online and published SCUBA guides and associated literature. While the dataset is thought to provide a thorough representation of where SCUBA diving is likely to take place in the region, it does not purport to represent the location of every location where SCUBA diving could take place. While man-made structures, such as wrecks and artificial reefs are finite in number, there are additional, enumerable sites that, while important to divers, may lack specific boundaries and which might not be known by many divers. Some locations have been buffered to address data confidentiality and site sensitivity concerns.
Status
These are final data products, representing data compiled in the early 2020s.
Examples of Data
- Recreational SCUBA Diving Areas
- REEF Dive Sites and Reports
Administrative Boundaries
Topic
Administrative Boundaries
Administrative Boundaries data show major government-defined boundaries that are broadly relevant to ocean planning. More specific types of administrative boundaries can be found under other Topics such as Commercial Fishing (Management Areas) and Aquaculture (Shellfish Management Areas).
Latest Updates
No recent changes to Administrative Boundaries data
Data Providers and Sources
- NOAA Fisheries Greater Atlantic Regional Fisheries Office
- NOAA National Marine Sanctuary Program
- NOAA National Ocean Service (NOS)
- NOAA Office of Coast Survey (OCS)
- US Army Corps of Engineers
- US Coast Guard
- US Department of Homeland Security
- US Fish and Wildlife Service
- US Census Bureau
Data Considerations
In the Data Explorer, the Layer Information popup provided for each dataset within Administrative Boundaries describes a specific agency source and/or authority responsible for the boundary. Users should consult the metadata for more detail.
Status
The data in Administrative Boundaries remain relatively consistent over time, but the Portal updates the data as needed and occasionally adds new datasets.
Examples of Data
- 12 NM Territorial Sea
- 200 NM Exclusive Economic Zone (EEZ)
- Coastal Barrier Resource System
- States
- Counties
- Federal Consistency Geographic Location Descriptions
- Northeast Canyons and Seamounts Marine National Monument
- Stellwagen Bank National Marine Sanctuary
- US Army Corps of Engineers Regulatory Boundary
- US Coast Guard Districts
- US Coast Guard Sectors
- Stellwagen Bank National Marine Sanctuary
Basemaps
Updates
- Updated Regional Seafloor Geomorphology Maps – Seascapes II
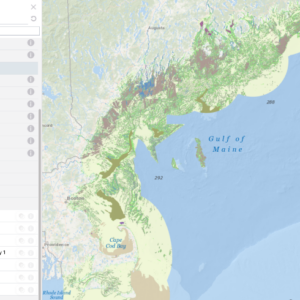
- NROC Habitat Classification and Ocean Mapping Subcommittee’s Seafloor Mapping Prioritization
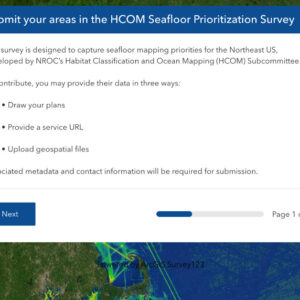
- Public Comment Opportunity: Shipping Safety Fairways Along the Atlantic Coast
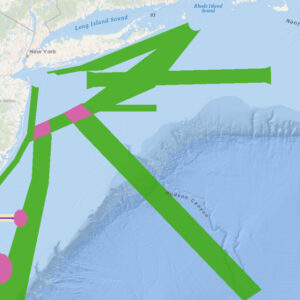
- Hundreds of New and Updated Plankton Datasets
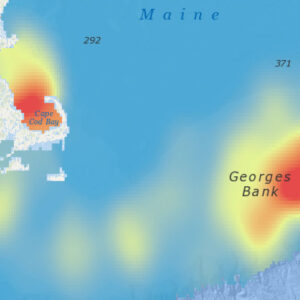
- New and Updated Regional Seagrass Data
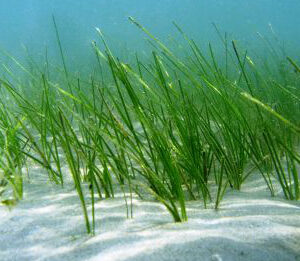
- Updated Aquaculture Data Directly from the States
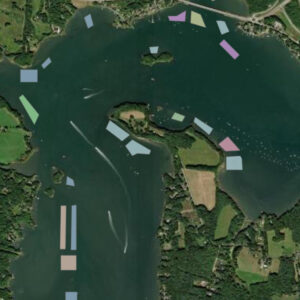
- Proposed Commercial Blue Mussel Mariculture Facility
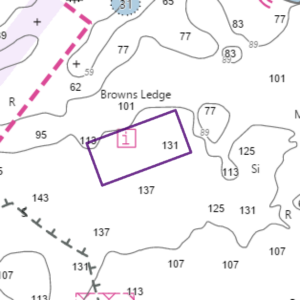
- Upcoming Outreach Events in New England for U.S. Army Corps of Engineers Nationwide Permit Program

- New Data Products Track Marine Heatwaves and Show Habitat Change for Marine Top Predators in a Changing Ocean

- Data Portal Newsletter – December 2025
- Updated and New Fish Abundance Data from Coastal Trawl Surveys

- Coastal Buoy Modernization Proposal Update

- New 2024 Vessel Traffic Data, Maps, and Tools

- Redesigned Northeast Ocean Data Portal Site Launched!
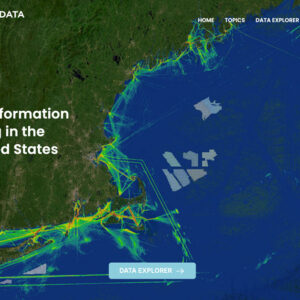
- Portal Featured in ESRI’s ArcNews
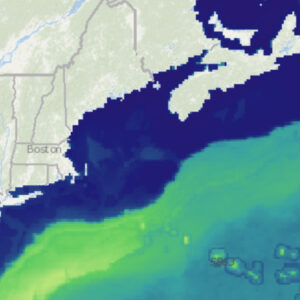
- Updates to Zooplankton Products from NOAA Fisheries EcoMon Surveys
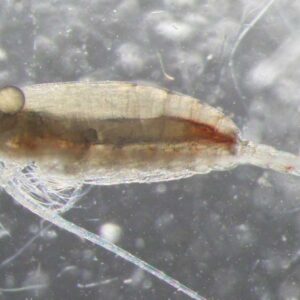
- Coast Guard First District Coastal Buoy Modernization Initiative Proposal

- Public Comment Opportunity: New England Shelf Hydrogeology Expedition
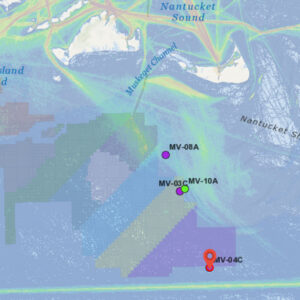
- Data Portal Newsletter – March 2025
- Public Webinar: Northeast Ocean Data Portal Redesign Update – Recording Now Available
menu
layers
map
notifications_active

Lat: Long:
Map contains User Added layers

+
-

northeastoceandata.org
about this map
legend
Adjust Sliders to Update Threshold results
Communities at Sea
Use the following settings to update the Data
Available Information
Save this image
Select Map Size
- 11x17 recommended for maps with many layers or layers with larger legends
- Please enable popups in browser as map will be downloaded as a popup
share this map
Click on an icon to share a custom link to your map:
![]()


The link will show the map exactly as you see it now, including the same data layers, geographic area, zoom level, and basemap.
Or copy and paste the link:
Add layers to the map
The Add Layers tool enables Portal users to add data from other sources to be viewed on the Data Explorer interactive map. The layers are added temporarily and privately. They will be viewable only by you and will disappear when you reload or leave this page.
Layers can be added in two ways: (1) by entering the URL for an ArcGIS REST map service or (2) by uploading a data file (CSV, KML, or zipped shapefile).