Northeast Ocean Data Portal User:
United States Coast Guard, 1st District
Objectives:
To manage the complex waterways of the Northeast, including (1) determining if changes are needed in navigational routes and location of aids to navigation, (2) analyzing potential impacts of offshore wind energy development on vessel traffic and safety, and (3) optimizing the deployment of ice-breaking ships.
As the lead Federal agency protecting the nation’s Maritime Transportation System (MTS) and the primary regulator of the maritime shipping industry, the United States Coast Guard advances American prosperity by supporting safe and secure ports and waterways that enable commerce and ensuring that vessels are subject to uniform, consistent standards. The Coast Guard engages maritime stakeholders to identify potential conflicts, future marine use trends, and needs of the industry.
Ports in the Northeast are vital to the nation’s economic prosperity, with operations that impact approximately 80 million people, or 25 percent of the country’s population. Nearly 40 percent of the Coast Guard-managed coastal buoys in the United States are in the Northeast, and the Coast Guard’s fleet of ice breakers and buoy tenders is critical to ensuring vessels carrying petroleum get to and from ports in order to keep homes warm and that fuel is available at the pumps.
In the First District, the United States Coast Guard uses the Northeast Ocean Data Portal as one of its tools to provide up-to-date, timely, relevant, accurate, and user-accessible information, as illustrated by the following four examples.
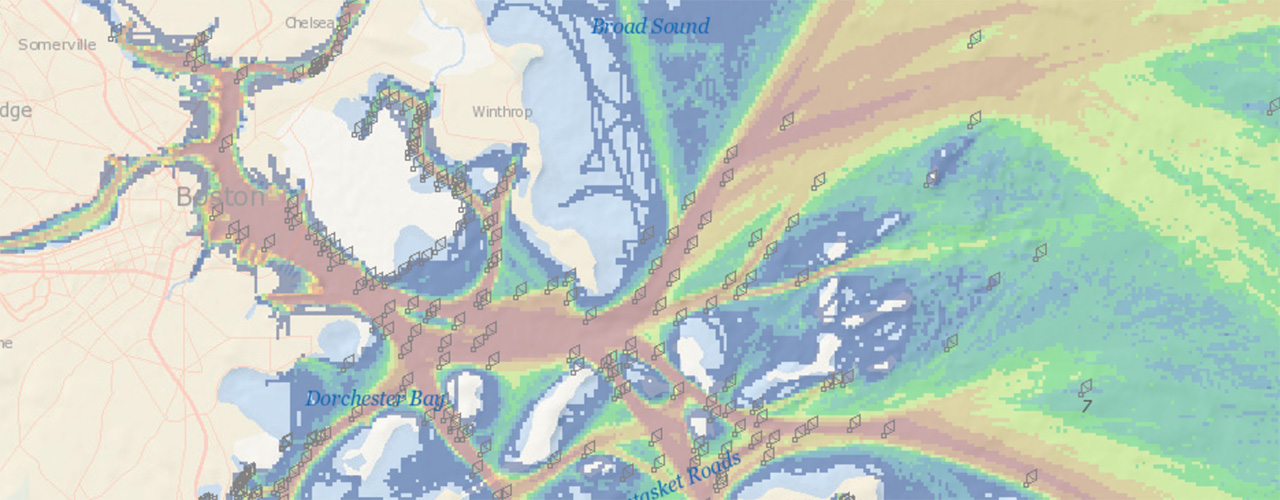
As part of its Waterways Analysis and Management System studies, the Coast Guard uses the Portal to visualize vessel traffic data overlaid with buoys and other aids to navigation. On this screenshot of a Portal map of Boston Harbor and vicinity, buoy symbols represent aids to navigation, and background colors indicate vessel traffic. Launch interactive map
Waterways Analysis and Management System Studies (WAMS)
The USCG performs studies to characterize waterways and ensure that they are being used in a safe and intended manner. To conduct Waterways Analysis and Management System (WAMS) studies, USCG personnel need to determine, for example, whether navigational buoys and other aids to navigation are being used properly or whether they could be located more effectively. In the Northeast, USCG analysts turn to the Portal’s Data Explorer, which enables them to overlay vessel traffic patterns and aids to navigation on the same map.
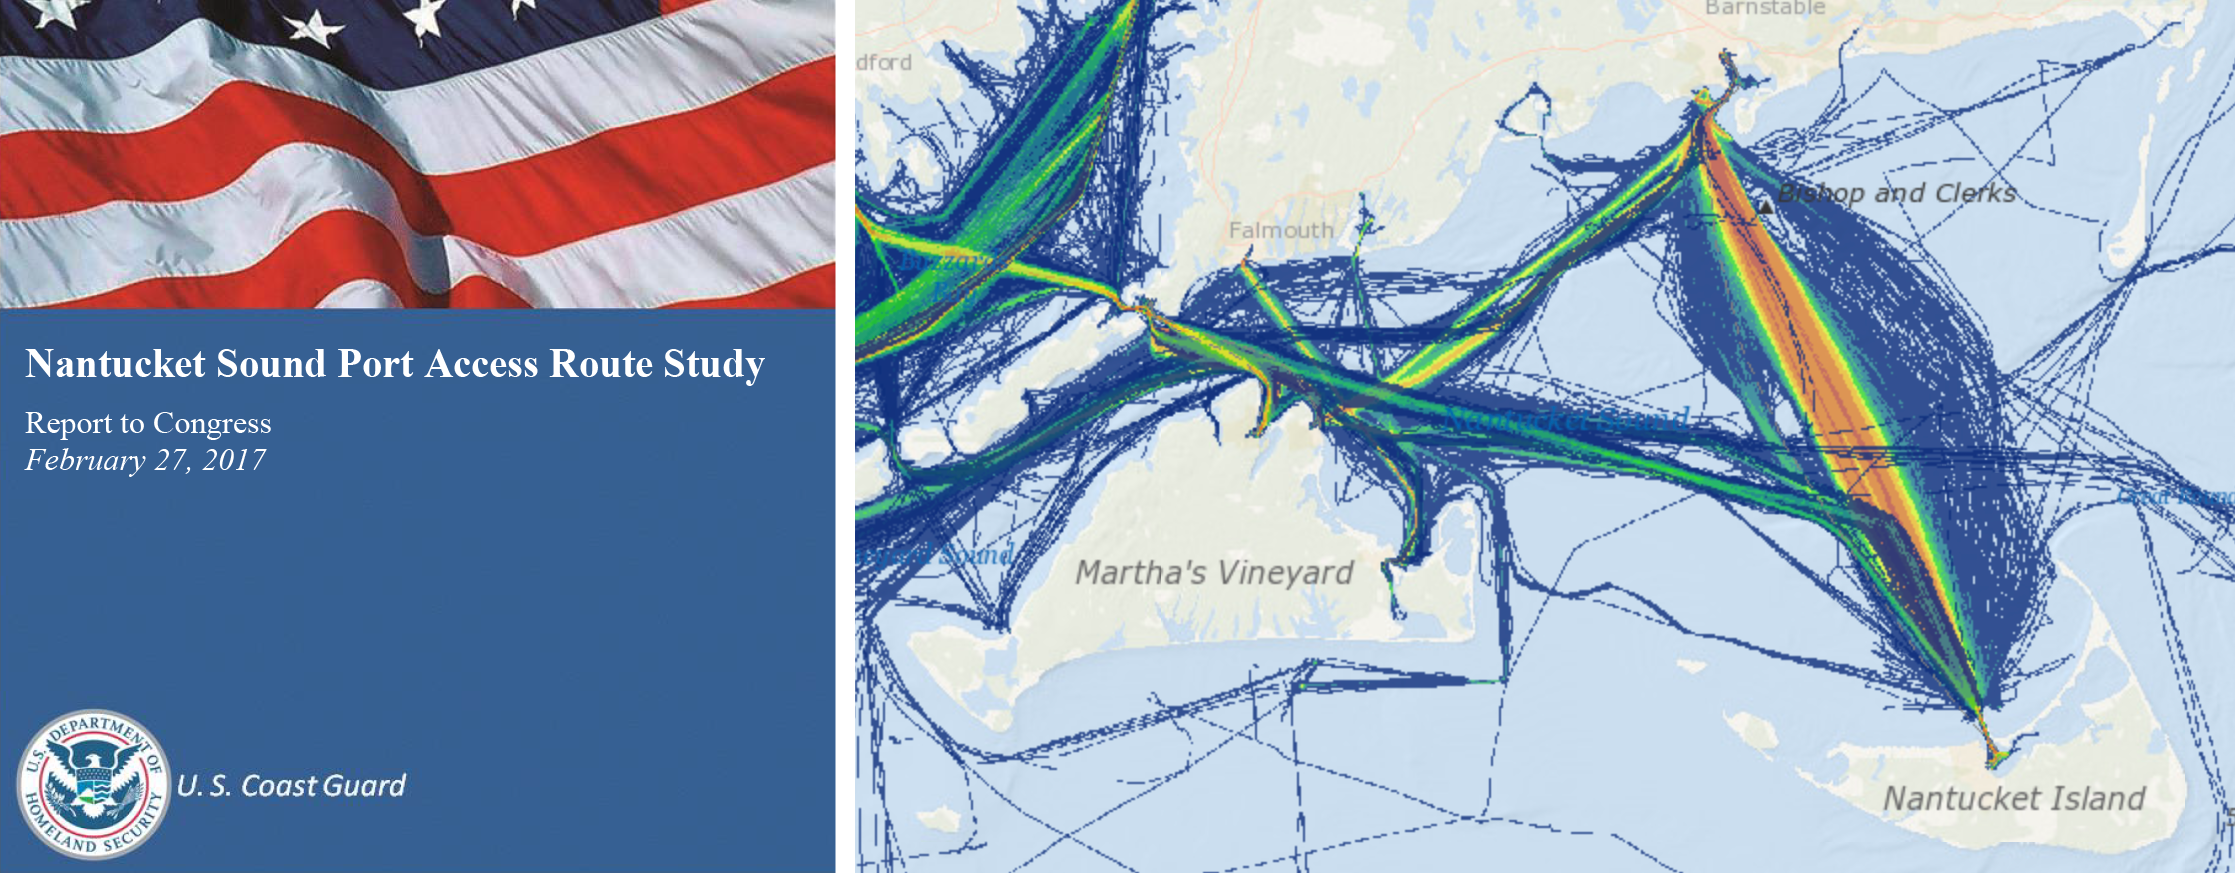
The Coast Guard conducted a Port Access and Route Study (left) for Nantucket Sound using vessel traffic data from the Northeast Ocean Data Portal (right). Launch interactive map
Port Access and Route Studies (PARS)
The Coast Guard Authorization Act of 2015 directed the Coast Guard to undertake a Port Access and Route Study (PARS) for Nantucket Sound to determine whether existing regulations should be revised to improve navigation safety due to factors such as increased vessel traffic, changing vessel traffic patterns, or navigational difficulty. USCG District 1 staff used the Portal to examine patterns in vessel traffic in the Sound, including large vessels such as passenger ferries, as well as commercial fishing vessel traffic. The Portal provided critical data and information to allow District 1 staff to conduct an initial review and hone their research on navigation safety in the area. The completed Nantucket Sound Port Access Route Study, published in 2017, includes maps from the Portal.
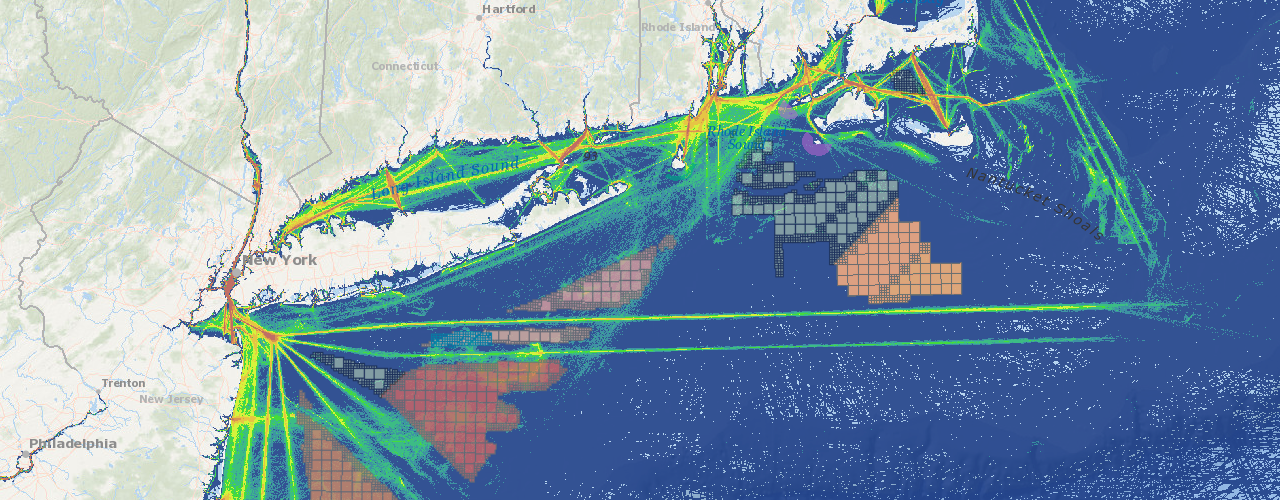
The Coast Guard uses the Portal’s maps of vessel traffic (red: high; blue: low) and potential offshore wind development areas (colored boxes) to analyze how development of offshore wind farms might affect navigation and safety. Launch interactive map
Assessing Effects of Offshore Wind Development on Navigational Safety
The USCG uses data on the Portal to analyze how development of offshore wind farms could affect navigational safety. For example, USCG staff used maps of vessel traffic overlaid with proposed Wind Energy Areas (WEAs) to compare traffic year to year and to characterize the volume and type of traffic in WEAs. By overlaying these layers with data on water depth (bathymetry) and using nautical charts as the basemap, the Portal also helped them determine if vessels were already avoiding proposed WEAs because of existing seafloor hazards or because WEAs were outside the most economical vessel routes.
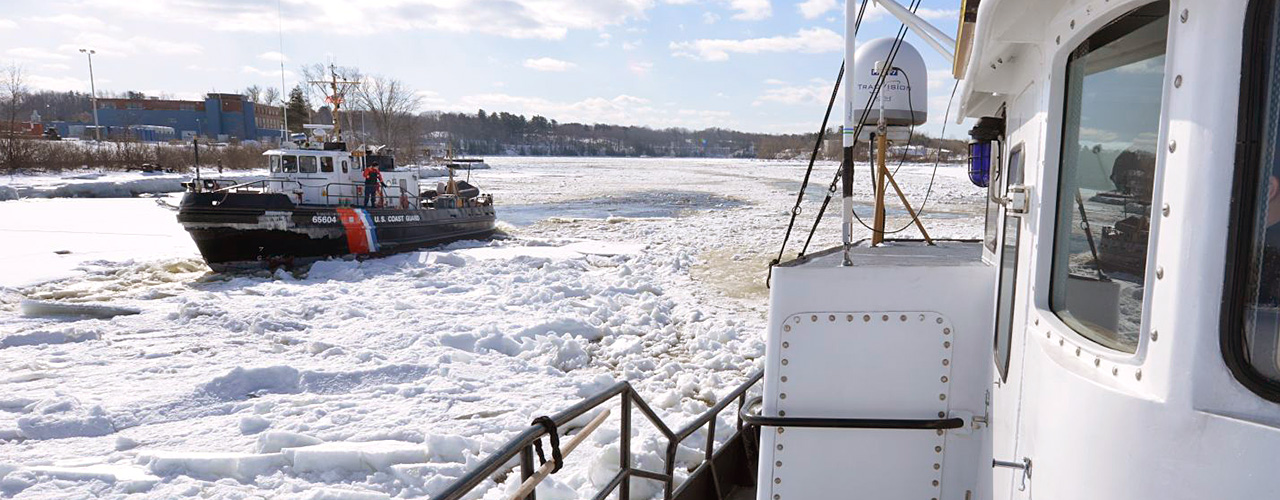
Each winter, the Coast Guard deploys icebreakers to keep waterways such as the Penobscot River (above) open for commerce and to reduce flooding risks. The Portal’s vessel traffic data help the Coast Guard to identify priority areas for ice-breaking operations.
Planning Ice-Breaking Operations
The Portal is used as one source of information to understand where maritime traffic might encounter ice. Combined with real-time data provided by other sources, such as NOAA NOWCOAST and NERACOOS, vessel traffic maps on the Portal characterize where existing ice may be affecting the most mariners, which helps the USCG decide how to best deploy their limited ice-breaking cutter resources.
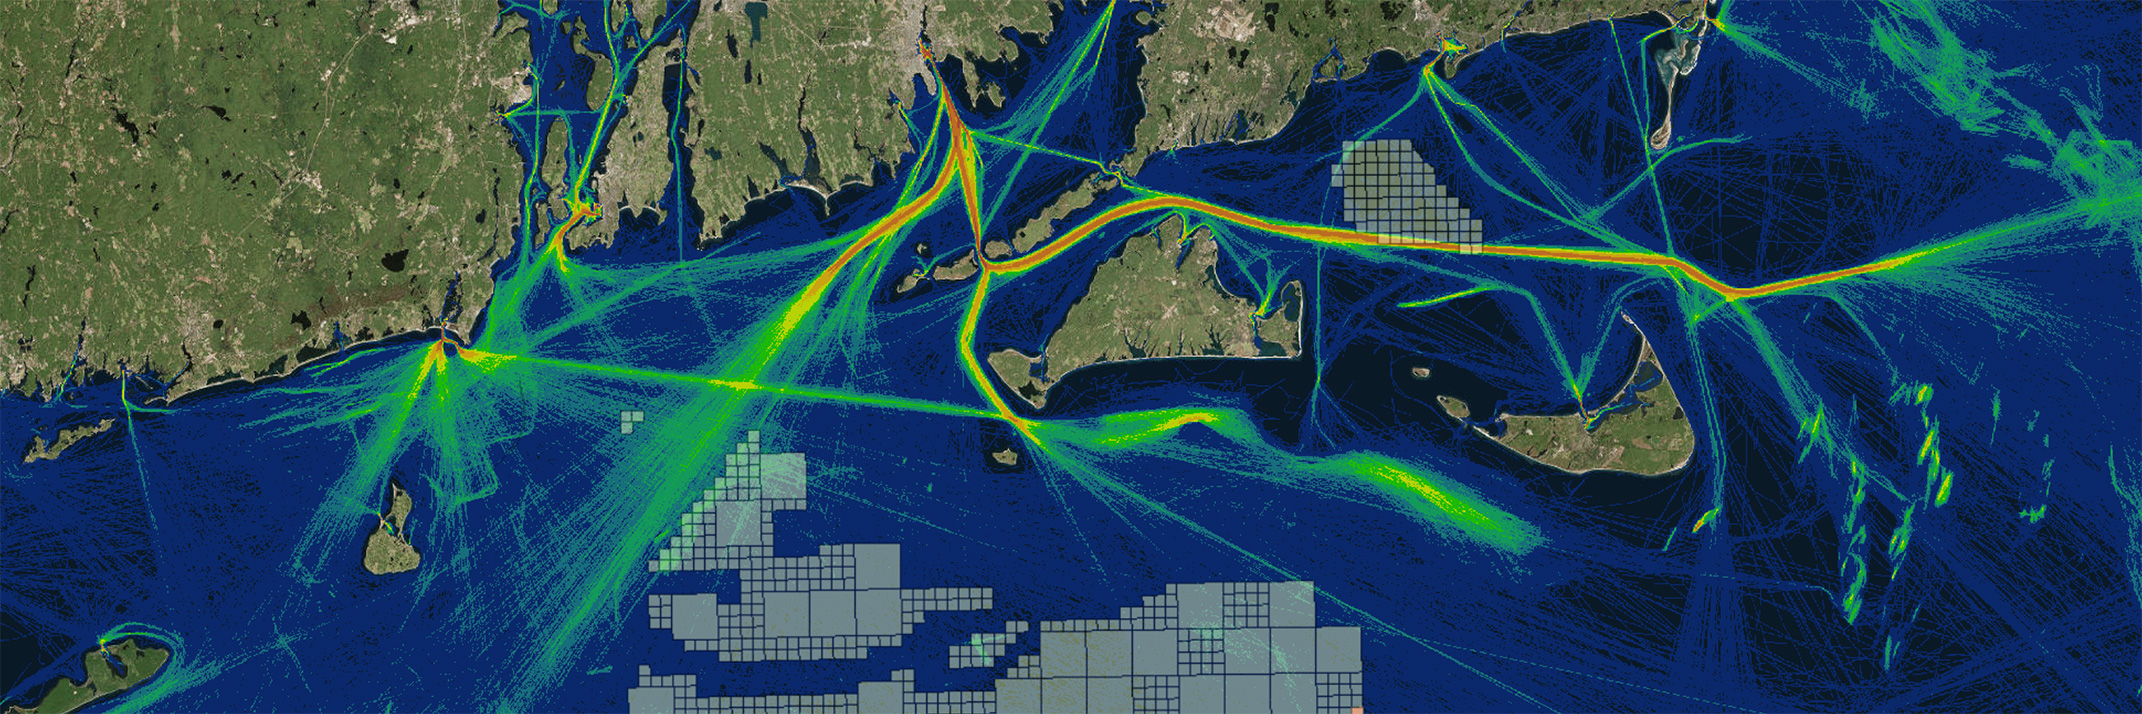
Image at top of page: Screenshot of a Portal map showing fishing vessel traffic (red: high; blue: low) and wind energy areas (colored boxes). Launch interactive map
Published: February 2019

