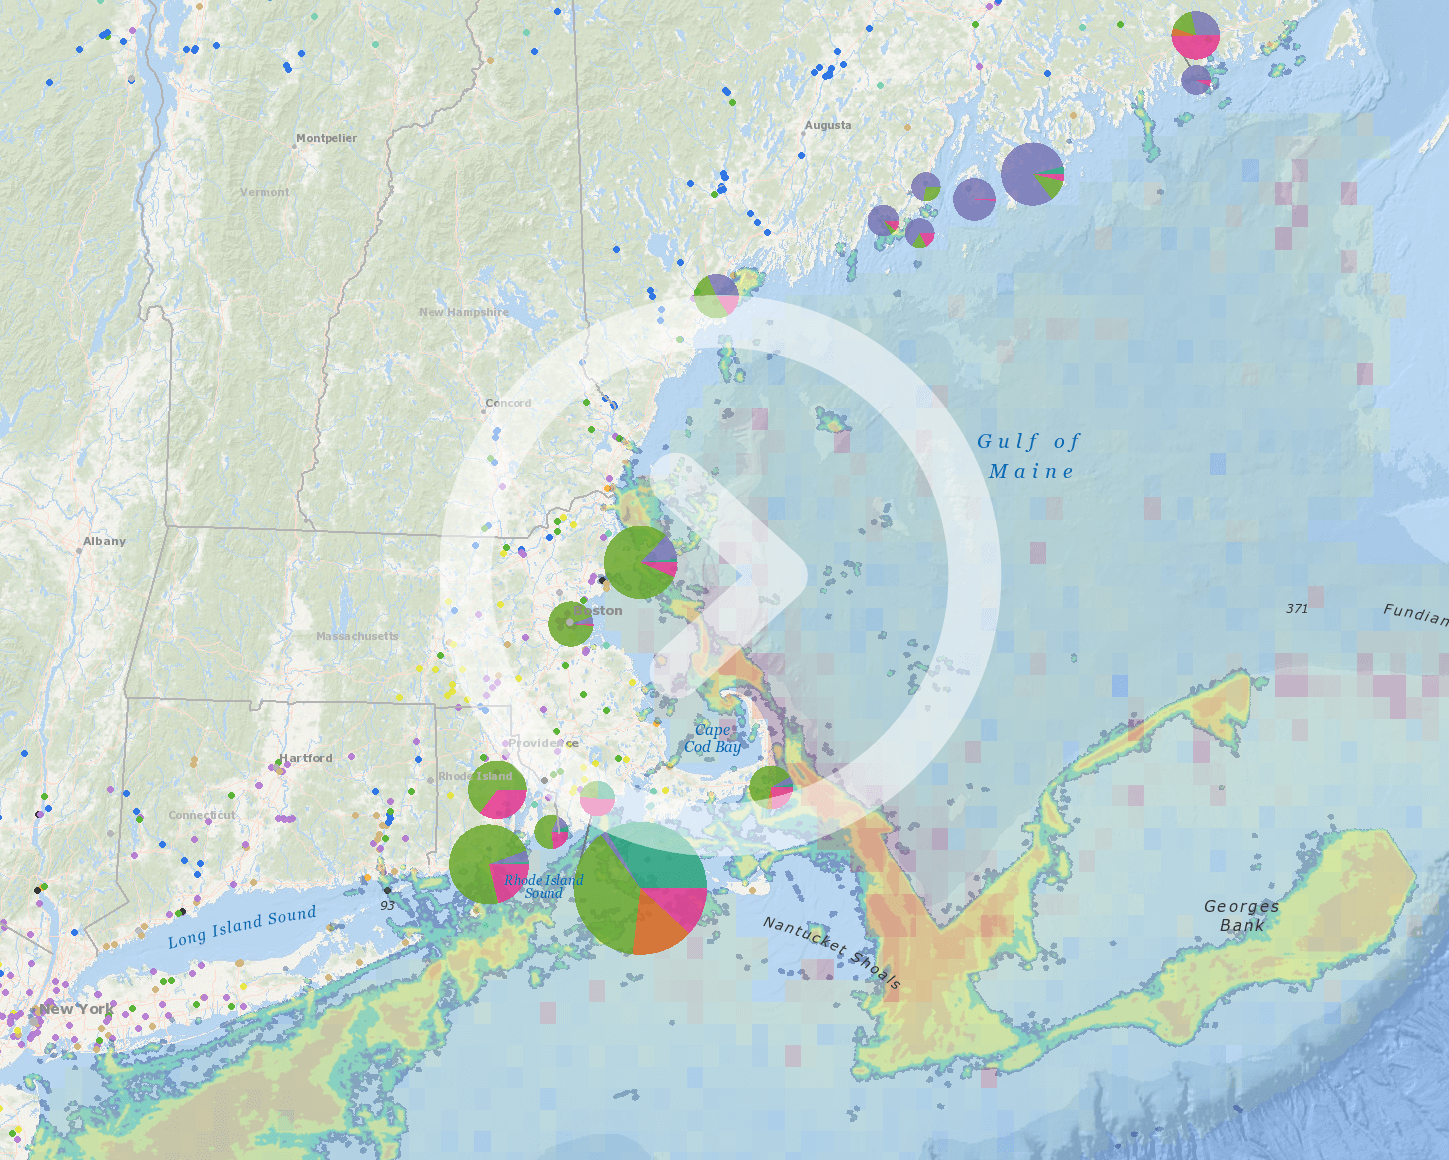
In partnership with the Connecticut Department of Energy and Environmental Protection (CT DEEP) Marine Fisheries Program, Northeast Ocean Data is releasing new maps of fish distribution and biomass in Long Island Sound. The maps show data from bottom trawl surveys conducted by CT DEEP aboard the R/V John Dempsey during the fall (September–October) from 1992 to 2014. Maps are available for 61 fish species and 3 invertebrates—from alewife to yellow jack.
The following image is a screenshot of one of the many maps available for the Long Island Sound trawl survey. This example shows striped bass biomass for 1992 to 2014.

To launch the interactive maps, click on the image or button above, or click on this link: https://www.northeastoceandata.org/HPruZT7r
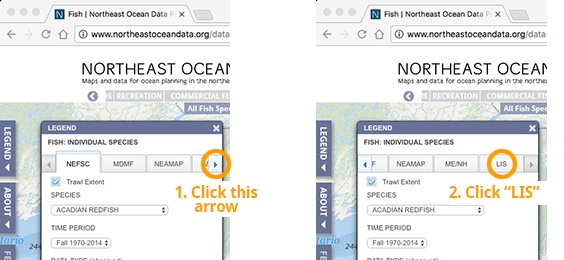
The new maps can also be accessed by navigating to the Fish theme map, clicking on the Individual Species tab, and in the Legend box clicking the right arrow and selecting “LIS”, as shown here:
When a species is selected in the Legend box, the map displays colored symbols indicating the biomass at locations around Long Island Sound. A line on the map outlines the geographic area covered by the trawl survey. In the Legend box, there is also the option to view data for either the full 22-year period (1992–2014) or only the most recent 10 years (2005–2014). Three data types are available: log biomass, mean log biomass, or variance of log biomass.
The new maps of CT DEEP fish data for Long Island Sound join the hundreds of fish biomass data products on Northeast Ocean Data that were developed in 2016 by the Marine-life Data and Analysis Team (MDAT). Together, the collection of maps displays fish biomass and distribution for the last several decades across the Northeast region.
Information about the Long Island Sound trawl survey methodology and the mapping methodology can be found by clicking on the About tab on the Fish map, or by clicking each species name in the legend.