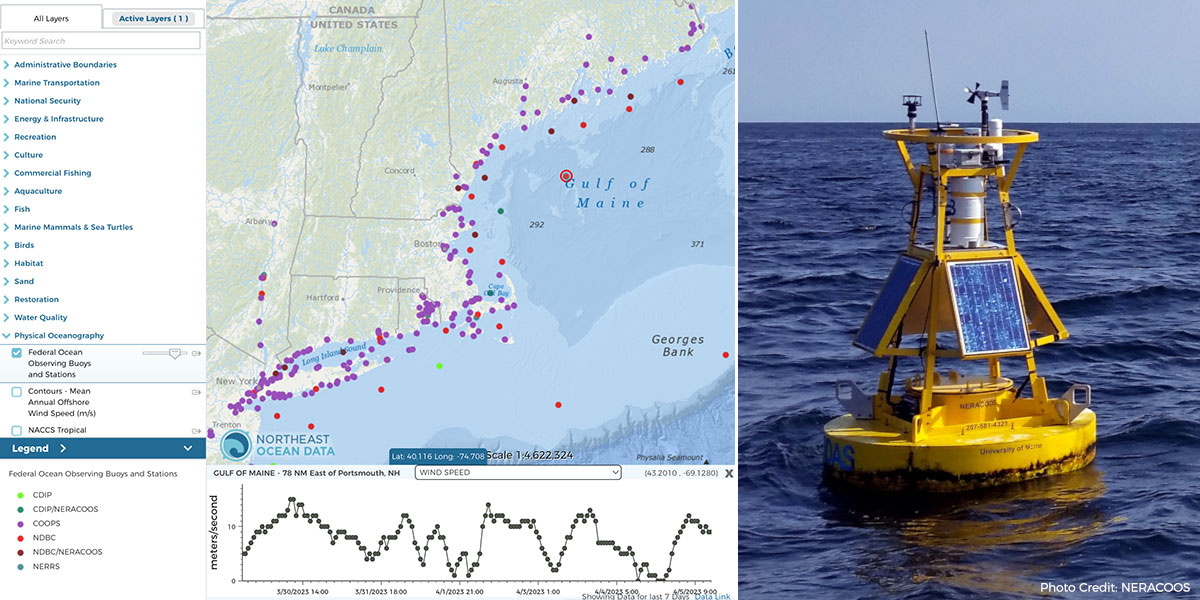
Left: Screenshot of Federal Ocean Observing Buoys and Stations map layer and seven days of wind speed data from Gulf of Maine buoy (circled in red on map). Right: Example of an ocean observing buoy equipped with instruments to collect data on conditions above, at, and below the sea surface.
Clicking on a buoy or station on the map opens a dynamically updated graph of ocean conditions for the past seven days at that location.
This map layer brings together individual datasets provided by numerous sources, and each of these programs operates stations with one or many partners. Sources include:
- Coastal Data Information Program (CDIP)
- NOAA Center for Operational Oceanographic Products and Services (CO-OPS)
- NOAA National Data Buoy Center (NDBC)
- Northeastern Regional Association of Coastal Ocean Observing Systems (NERACOOS)
- NOAA National Estuarine Research Reserves Systems (NERRS)
The Mid-Atlantic Regional Association Coastal Ocean Observing System (MARACOOS) data management and cyberinfrastructure system gathers and standardizes real-time measurements from these various observing networks and maintains long-term data stores and data services for each of them. The Northeast Ocean Data portal uses MARACOOS data services to make the most recent seven days of measurements available to users. The full datasets are available from MARACOOS at oceansmap.maracoos.org, and from NERACOOS at neracoos.org.
By clicking on a station point on the map, users can view a chart showing the measurement history for the last seven days for a selected variable. Users can select from a list of all the types of measurements collected at that station. Clicking on “Data Link” will bring the user to an OPeNDAP/ERDDAP link to download the data and to access longer time series.

How to View Recent Data from a Buoy or Station
1) Select “Federal Ocean Observing Buoys and Stations” under “Physical Oceanography.” 2) Click a buoy or station location on the map. The selected location is circled in red, and a graph will appear at the bottom of the map. 3) Select a data type from the menu above the graph. 4) Click “Data Link” in lower right corner if you want to download the data and access additional data.