Over the past year, the Marine life Data & Analysis Team (MDAT) and the NROC-MARCO Marine Life Fish Work Group collaborated on new fish biomass data products derived from the NOAA Northeast Fisheries Science Center (NEFSC) bottom trawl database. The new maps are visible in the Data Explorer and the Fish Stressor Groups theme map. All of the new data products can also be downloaded on the Data Download page.

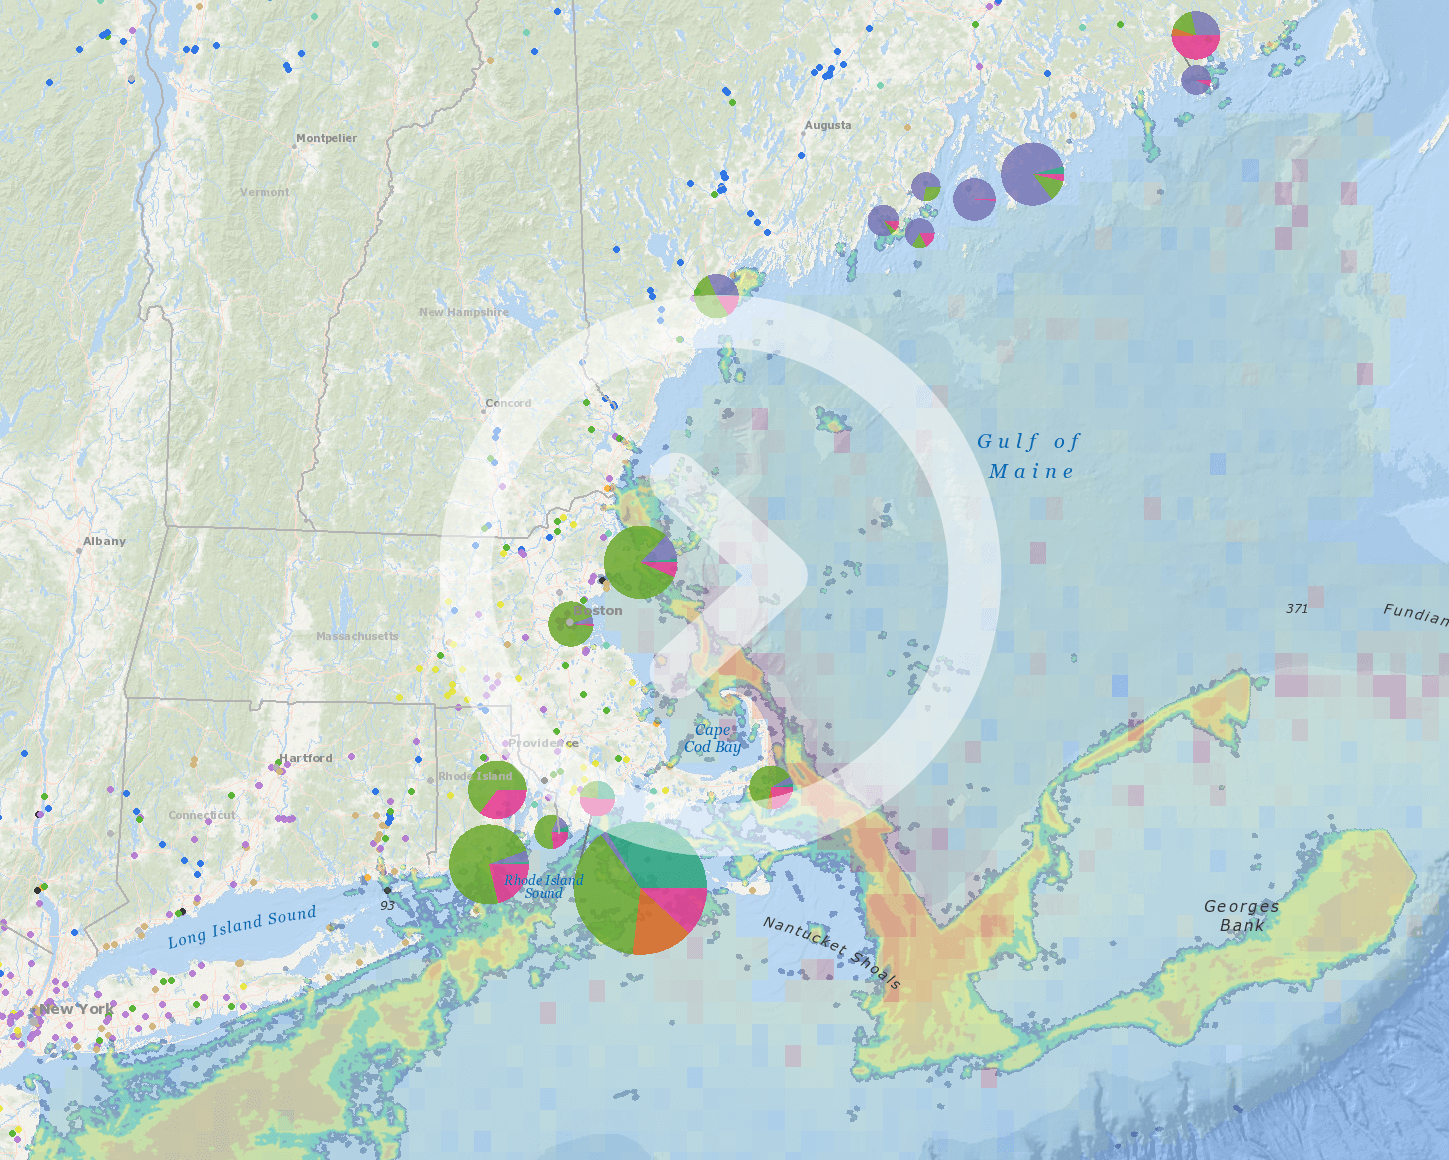
Data Explorer showing biomass of all fish species, Spring 1980-89.

Theme Map showing fish species Potentially Vulnerable to EMF (Species Richness, Spring 2010-19)
New Fish Biomass Time Slider
In fall of 2021, MDAT and the Fish Work Group developed updated data products from the NEFSC trawl that depict spring and fall fish biomass from the most recent complete decade – 2010-2019. The new time slider data products released today complement these products by depicting several previous decades of NEFSC trawl data. Layers in the time slider represent average total biomass from 1980-1989, 1990-1999, 2000-2009, 2010-2014 and 2015-2019. The changeover to 5-year increments was implemented to add additional temporal resolution to recent time periods supporting current management decision making. Symbology for each species group was determined by the distribution of values from the most recent decade and applied to all time steps in the series, allowing comparisons between seasons and decades within a given species group. These new layers were created for the species groupings: All Fish species, Demersal species, Forage species, and Diadromous species.
To access the new time slider, first select Fish in the Data Explorer, click on “Observed biomass (MDAT)”, and then select “Observed biomass (MDAT) Historical”. Check the box next to a Historical Biomass layer and a clock icon will appear. By default, the map shows the first decade of available data (1980-1989) in spring. Click the clock icon to open the time slider and click the arrows to advance through decades or to switch between spring and fall.
How to Access the Time Slider
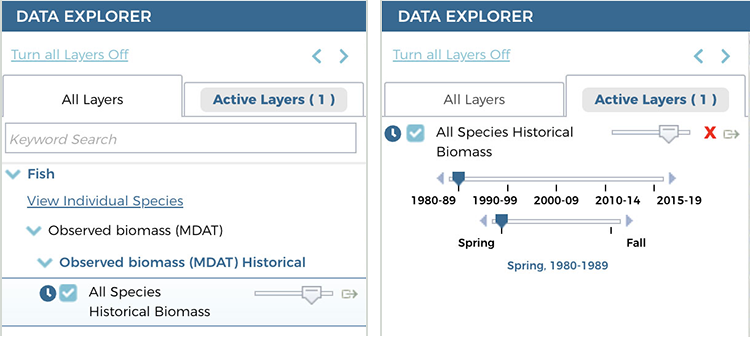
Left: Under Fish > Observed biomass (MDAT) > Observed biomass (MDAT) Historical, select All Species Historical Biomass or one of the other options. Then click on the clock icon or the Active Layers tab. Right: The time sliders will show up on the Active Layers tab. Click on the arrows or timeline to select a time period. The data for the time period will display on the map.
Demo of Fish Biomass Time Slider
The Fish Work Group was asked to consider developing new data products related to fish species’ potential vulnerability to electric and magnetic fields (EMF) associated with submarine power cables. The Work Group used the list of species in the 2019 BOEM study “Evaluation of Potential EMF Effects on Fish Species of Commercial or Recreational Fishing Importance in Southern New England” to map the total biomass and species richness in spring and fall of a new group called “Potentially Vulnerable to EMF”. The list includes pelagic and demersal species that are known to have electric or magnetic senses (e.g., skates and sharks) and those that likely do not have these senses but may be exposed to EMF due to their habitat use. The BOEM report concluded that regardless of the likelihood of exposure to EMF, negligible or no negative effects from EMF exposure are anticipated for these species. To access these new layers, view them in the Fish Stressor Groups theme map or in the Data Explorer under Fish > Observed biomass (MDAT) > Stressor Groups.

Data Explorer showing biomass of fish species categorized as Potentially Vulnerable to EMF (Fall 2010-2019).