In September 2023, a NOAA study found that a majority of marine mammal stocks managed under U.S. jurisdiction in the western North Atlantic, Gulf of Mexico, and Caribbean Sea are very highly vulnerable or highly vulnerable to climate change. A “stock” is a group of organisms of the same species that occupy the same geographic area and interbreed when mature.
In collaboration with the NOAA Fisheries staff who authored the study, the Marine-life Data & Analysis Team (MDAT) developed new data products that depict the total abundance and species richness of marine mammals in the western North Atlantic (U.S. east coast) that are vulnerable to climate change.

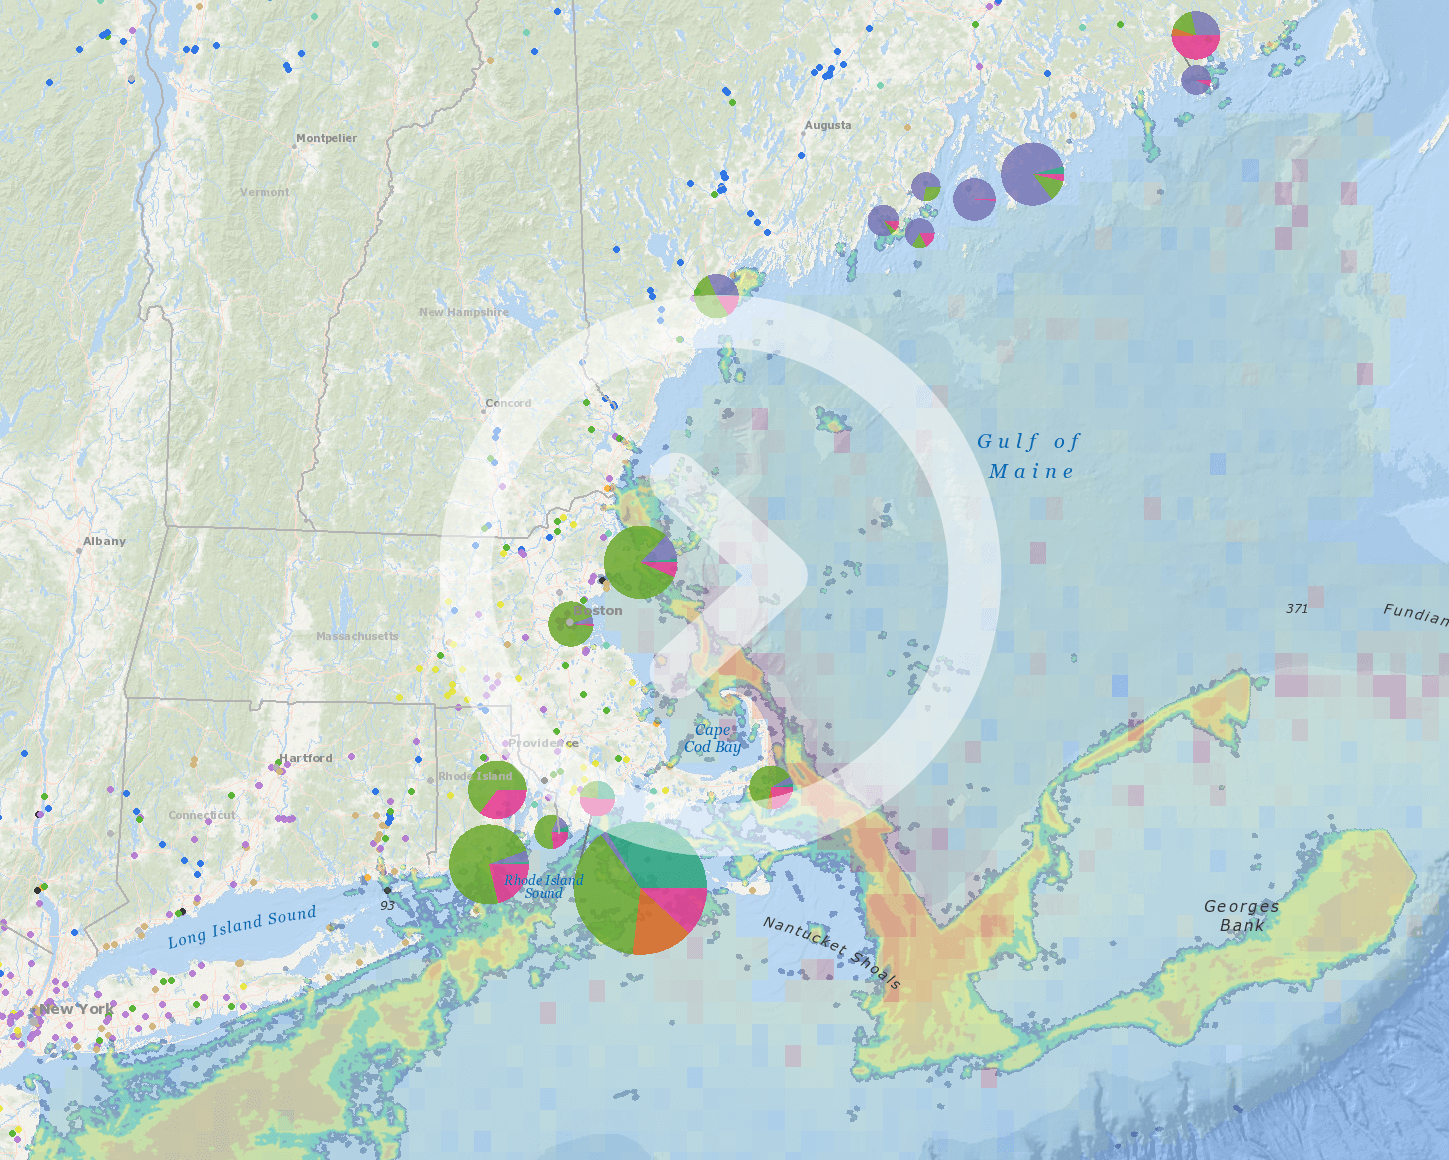
Screenshot of new map layer displaying data on Sensitivity to Climate Related Changes in Distribution: Total Abundance for marine mammals. Red areas have the highest numbers of individuals in each cell of species that have Very high and High sensitivity to climate change related changes in distribution.
The eight new data products can be found in the Data Explorer under Marine Mammals > Modeled distribution (MDAT) > Stressor Groups and in the Marine Mammals Theme Map.
- Vulnerability to climate change: Total abundance – number of individuals in each cell that have Very high and High vulnerability to climate change. View in Data Explorer
- Vulnerability to climate change: Species Richness – number of species in each cell that have Very high and High vulnerability to climate change. View in Data Explorer
- Sensitivity to climate related changes in abundance: Total Abundance – number of individuals in each cell that have Very high and High sensitivity to climate change related changes in abundance. View in Data Explorer
- Sensitivity to climate related changes in abundance: Species Richness – number of species in each cell that have Very high and High sensitivity to climate change related changes in abundance. View in Data Explorer
- Sensitivity to climate related changes in distribution: Total Abundance – number of individuals in each cell that have Very high and High sensitivity to climate change related changes in distribution. View in Data Explorer
- Sensitivity to climate related changes in distribution: Species Richness – number of species in each cell that have Very high and High sensitivity to climate change related changes in distribution. View in Data Explorer
- Sensitivity to climate related changes in phenology: Total Abundance – number of individuals in each cell that have Very high and High sensitivity to climate change related changes in phenology. Changes in phenology are seasonal shifts (either earlier and/or later in the year) or temporal changes (prolonged and/or shortened) of life history events such as breeding or migration. View in Data Explorer
- Sensitivity to climate related changes in phenology: Species Richness – number of species in each cell that have Very high and High sensitivity to climate change related changes in phenology. View in Data Explorer
These data products add to an already extensive library of marine life data products that depict the distribution, density, and biomass of marine mammals, sea turtles, seabirds, and fish in the western North Atlantic hosted by MDAT, developed according to recommendations provided by experts throughout the regions and visualized on the Northeast Ocean Data Portal and Mid-Atlantic Ocean Data Portal.
NOAA Fisheries conducts climate vulnerability assessments for coastal and marine habitats and species as part of its Climate Science Strategy. The latest vulnerability assessment for marine mammals was published in PLOS ONE. It provides new information on the potential outlooks for these stocks in the face of a changing climate. The Portals already housed similar climate vulnerability data products for Fish. You can explore Climate Vulnerability Assessment data for marine mammals and other stocks with NOAA Fisheries’ new Climate Vulnerability Assessment Tool.
Resources:
- Lettrich MD, Asaro MJ, Borggaard DL, Dick DM, Griffis RB, et al. (2023) Vulnerability to climate change of United States marine mammal stocks in the western North Atlantic, Gulf of Mexico, and Caribbean. PLOS ONE 18(9): e0290643. https://doi.org/10.1371/journal.pone.0290643
- Roberts, J., Best, B., Mannocci, L. et al. Habitat-based cetacean density models for the U.S. Atlantic and Gulf of Mexico.Sci Rep 6, 22615 (2016). https://doi.org/10.1038/srep22615
- Roberts JJ, Yack TM, Halpin PN (2023) Marine mammal density models for the U.S. Navy Atlantic Fleet Training and Testing (AFTT) study area for the Phase IV Navy Marine Species Density Database (NMSDD). Document version 1.3. Report prepared for Naval Facilities Engineering Systems Command, Atlantic by the Duke University Marine Geospatial Ecology Lab, Durham, North Carolina.
- NOAA Fisheries press release (September 20, 2023): Marine Mammal Stocks in North Atlantic, Gulf of Mexico, and Caribbean Are Highly Vulnerable to Climate Change
- A Method for Assessing the Vulnerability of Marine Mammals to a Changing Climate
- NOAA Fisheries Climate Vulnerability Assessments