and the Isles of Shoals (right).")
A view of the new four-meter resolution bathymetry layer in the vicinity of the New Hampshire seacoast (left) and the Isles of Shoals (right).
The Northeast Ocean Data Portal has released four new layers that provide access to high-resolution bathymetry data and information. All four layers can be accessed via the Bathymetry & Imagery category in the Data Explorer and can be overlaid with any other type of data on the Portal.
Northeast Regional Bathymetry Composites: 4- and 16-Meter Resolution
These two layers represent syntheses of high-resolution multibeam echosounder (MBES) data compiled by the University of New Hampshire Joint Hydrography Center/Center for Coastal and Ocean Mapping (UNH JNC/CCOM). One hundred and ninety-six surveys conducted by multiple agencies were used to construct the bathymetry compilations. These maps now span the Gulf of Maine through Long Island Sound, whereas previous versions were focused on the Gulf of Maine. The high-resolution bathymetry syntheses are composed primarily of MBES surveys enhanced by lidar in very shallow water. The original gridding, survey source, and other relevant information can be accessed on the UNH JHC/CCOM website.

Screenshot of the 16-meter resolution bathymetry map.
Surveys with Digital Sounding Data
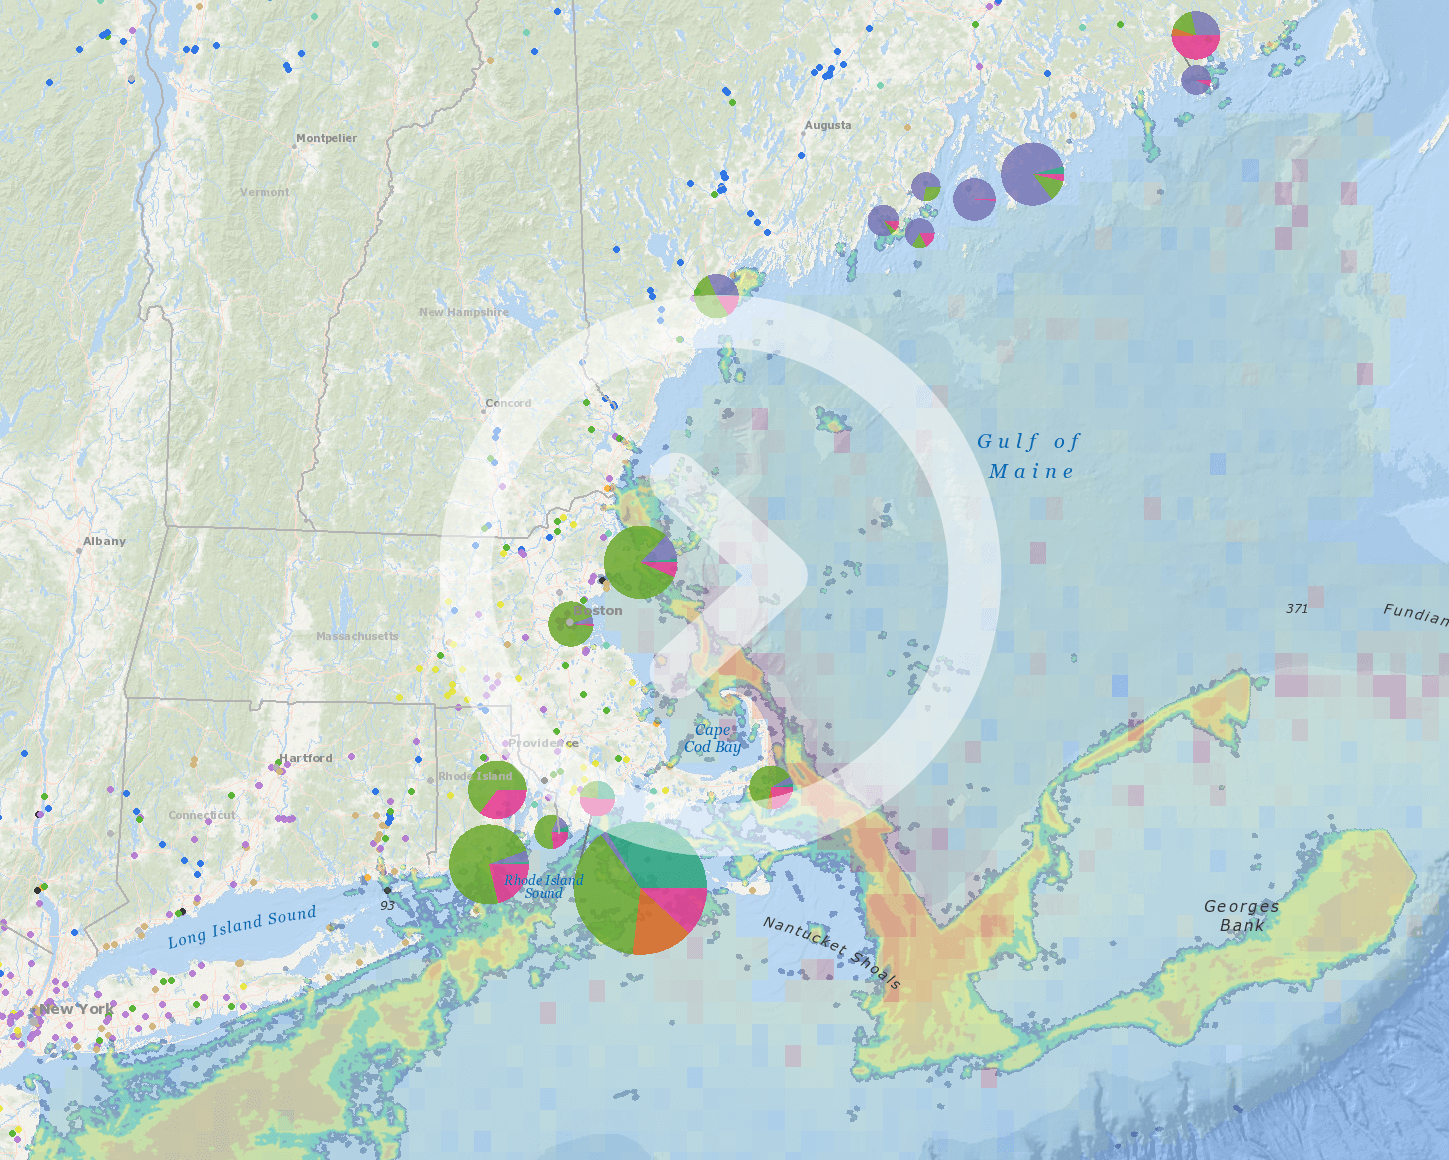
This layer shows the location and coverage of all available digital hydrographic survey datasets from the National Ocean Service (NOS). This layer was developed and is maintained by NOS and NOAA’s National Centers for Environmental Information (NCEI). It shows the extensive survey coverage of the coastal waters and Exclusive Economic Zone (EEZ) of the United States and its territories. By clicking on the Identify button in the upper right corner of the Data Explorer map and then clicking on a survey area, users can find information about each area’s year of survey and methods, and a clickable link to download the data directly from NCEI.

Planned NOAA Hydrographic Survey Areas (3-Year Outlook)
NOAA’s Office of Coast Survey produces this layer to display the footprints of planned hydrographic surveys for the next three years. These areas are derived from NOAA’s hydrographic survey priorities, constituent requests submitted through navigational managers, and other factors. Planned surveys are tentative and subject to change based on each fiscal year’s budget allocation, developing priorities, and emerging constituent requests.

Screenshot of Planned NOAA Hydrographic Survey Areas map layer.