Loggerhead sea turtle.
Through a collaboration with the Marine-life Data & Analysis Team (MDAT), the Northeast Ocean Data Portal and Mid-Atlantic Ocean Data Portal have expanded their marine life libraries to include new sea turtle surface density model data products developed by the Navy Undersea Warfare Center (NUWC) Division Newport and several other research institutions.
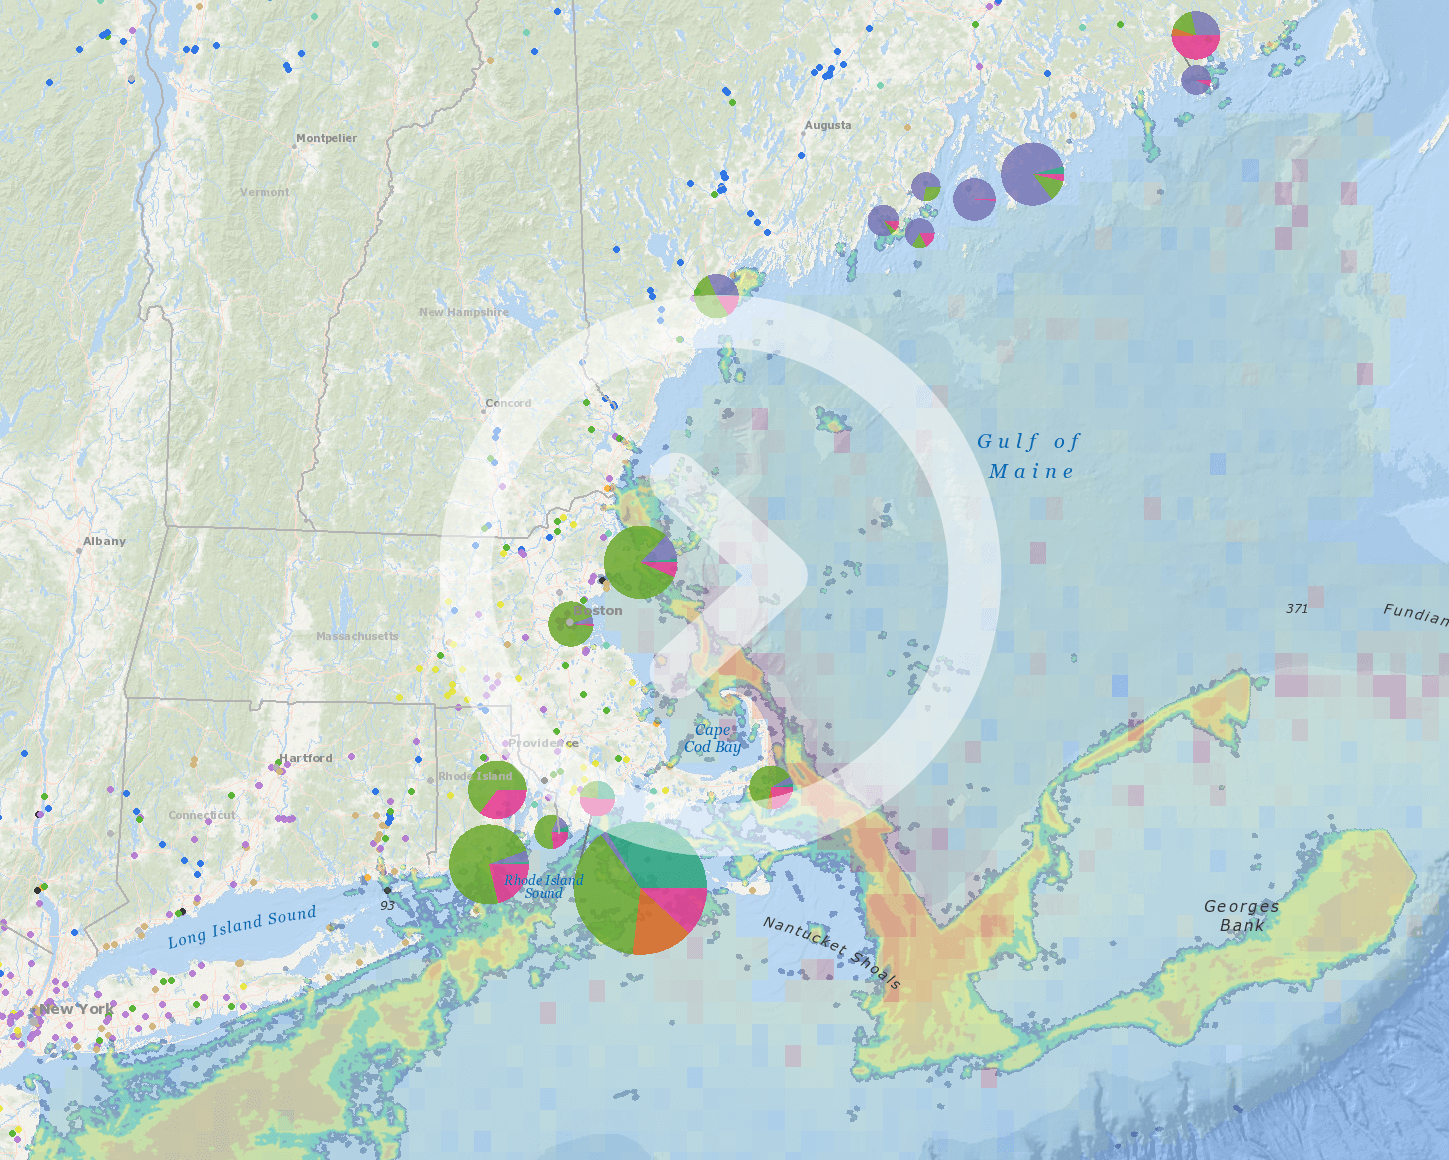
To view the new data products, Northeast Ocean Data Portal users can navigate to the new Sea Turtles theme map, or click on the “View Individual Species” link within the Sea Turtle category in the Data Explorer table of contents. The new data products include monthly estimates of average density and model coefficient of variation for four species: Green, Kemp’s Ridley, Loggerhead, and Leatherback sea turtles.

Screenshot of Data Explorer showing Loggerhead Sea Turtle: September Density map layer.
To produce monthly estimates of sea turtle density, the modeling framework used 27 environmental covariates that could explain or affect sea turtle density in the study area (e.g., depth, surface and bottom temperature, mixed layer depth, zooplankton biomass). A subset of the strongest covariates was used in each species model. Different model versions were tested and “trained” using 80% of the data and validated with the remaining 20%. The strongest model versions were then re-trained using the full dataset. The modeling framework also accounted for observed sea turtles that could not be identified to the species level by calculating the probability that an unidentified turtle belonged to one of the four species based on the environmental conditions at the location of the observation.
The models represent long-term average of abundance over 16 years, in a study area where survey effort was heterogeneous. As such, trends in sea turtle density and distribution will not be apparent in these data products. AMAPPS surveys, which are repeated, systematic, and cover the same study area, are a key data source for trend analyses.
A detailed technical report and forthcoming scientific journal article provide additional detail about the model inputs, methods, and results. The technical report includes figures that show the density model predictions overlaid with sightings and effort data for each species and each month. These figures can be used to interpret the model results and identify locations where additional observations are needed.
The model development process also highlighted data gaps and research needs, including better estimates of sea turtle availability bias and consideration of other ways to account for unidentified sea turtle sightings. Several of these issues have also been discussed by the RWSC Sea Turtle Subcommittee, a group of sea turtle experts who use these models in their work and will assist in the development of any additional “summary data products” such as a layer depicting the total estimated density of all sea turtle species in the study area, and/or total estimated density of hard-shelled turtles.
More information:
- MDAT sea turtle model repository
- Technical report: Sparks, Laura M. and Andrew DiMatteo (2023). Sea Turtle Distribution and Abundance on the East Coast of the United States. Technical Report prepared for Naval Undersea Warfare Center Division Newport. NUWC-NPT Technical Report 12,428; 1 June 2023. https://seamap.env.duke.edu/seamap-models-files/NUWC/Reports/TR_12428_FINAL_2023-06-01.pdf
- Forthcoming scientific journal article citation: DiMatteo Andrew, Roberts JJ, Jones D, Garrison L, Hart KM, Kenney RD, McLellan WA, Lomac-MacNair K, Palka D, Rickard ME, Roberts K, Zoidis AM, and Sparks L. (2023). Sea turtle density surface models along the United States Atlantic coast. Manuscript in review.
- Sea turtle individual species data product metadata
- Download the sea turtle models and documentation