The marine life layers now include seal (pinniped) density model outputs for the first time. Photo: Keith Luke/Unsplash
In collaboration with the Mid-Atlantic Regional Council on the Ocean and the Marine life Data & Analysis Team (MDAT), the cetacean data products on the Northeast Ocean Data Portal have been updated to reflect the latest model outputs developed by the Duke University Marine Geospatial Ecology Lab (MGEL; Roberts et al. 2023). The Roberts et al. (2023) cetacean models have been cited extensively and are being used by agencies and stakeholders to understand marine mammal distribution and abundance in the context of agency proposed actions in U.S. Atlantic waters. The new layers include several improvements to the previous models and now include seal (pinniped) density model outputs for the first time.
The full suite of 31 updated density models for 26 cetacean species and 5 species guilds produced using updated methodology and survey data conducted through 2020 is now available to view in the Marine Mammals & Sea Turtles theme map or by selecting the Marine Mammals & Sea Turtles category in the Data Explorer.

Baleen Whales: Total Abundance
This map is a summary product showing total abundance of baleen whales: blue whale, fin whale, common minke whale, North Atlantic right whale, and sei whale. Total abundance maps are calculated in a Geographic Information System (GIS) by stacking each individual species’ predicted annual abundance layers and summing the values of the pixels in each resulting “column”. The result is the total predicted abundance of all individuals (of the included species) in that cell.

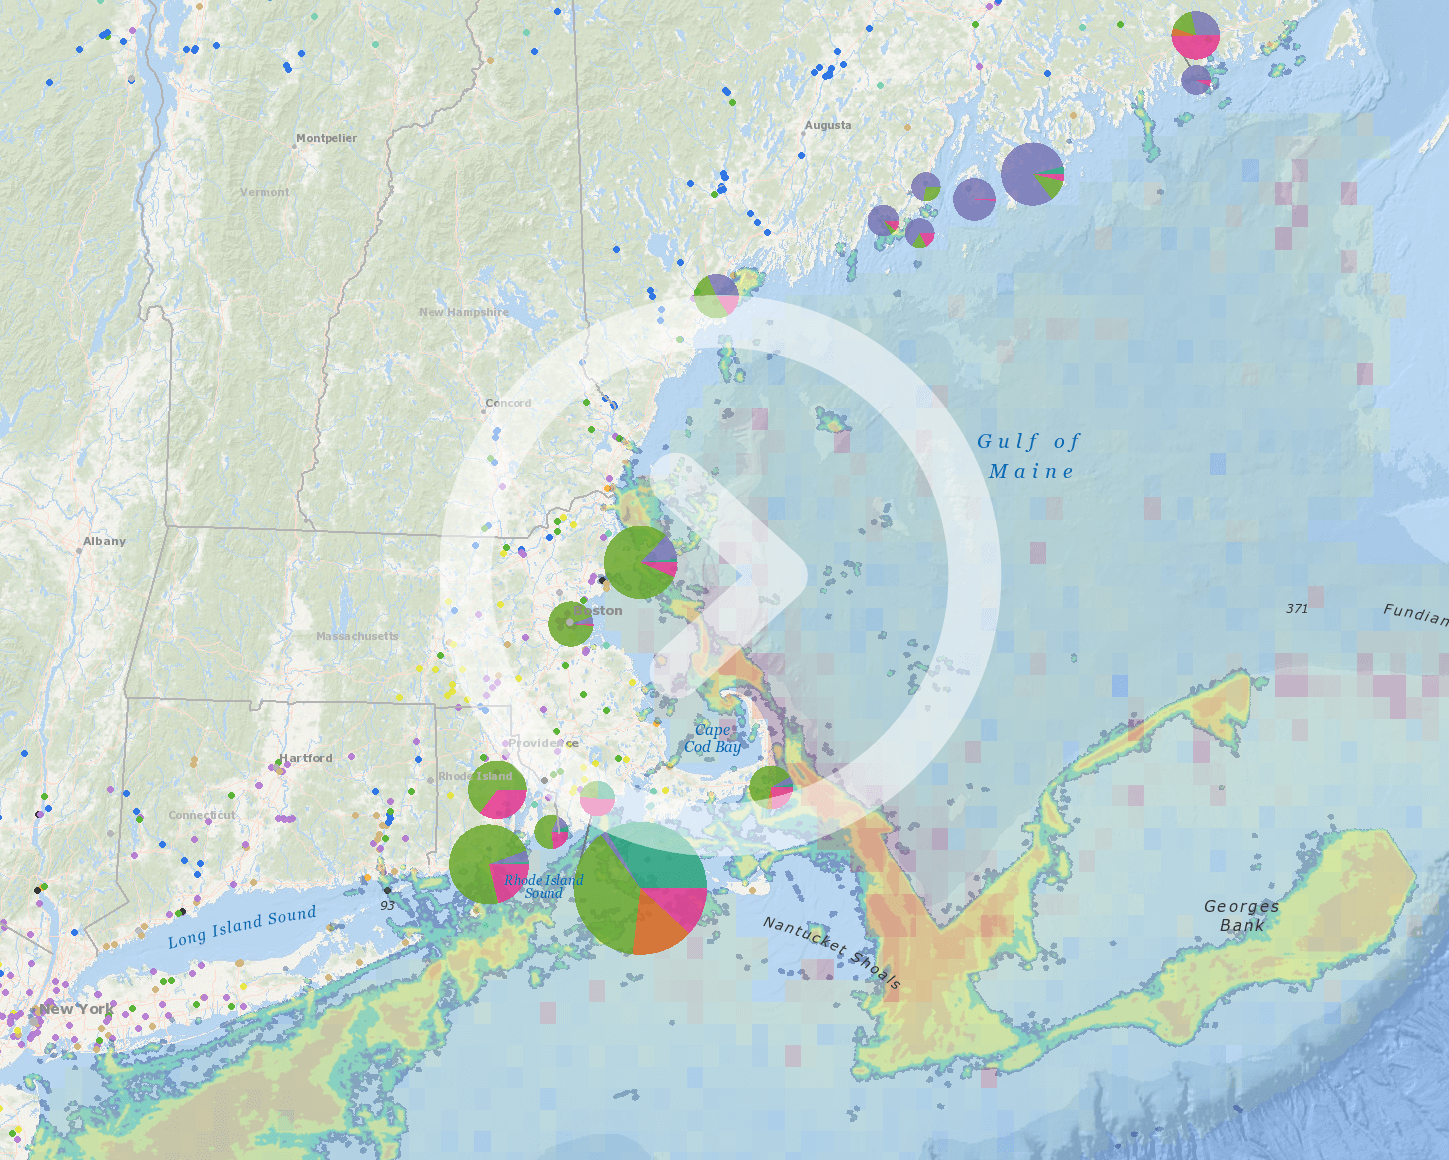
Common Minke Whale: Average Density (May)
This map is an individual species model output showing average density of the common minke whale in the month of May. Density model results are the predicted number of animals per 100 square kilometers for the temporal period (month or annual average) selected. Source data used to create the models are primarily from 1998 through 2020 (view model documentation for certain exceptions). Model resolution is 5km x 5km and models were generated with an original extent to the US EEZ boundary along the entire US Atlantic coast, and with some model results extending into Canadian waters. Species-specific seasons are based on patterns in the sightings and reports in the literature.
- The total amount of survey data integrated into the models increased significantly—by 255% for aerial effort and 93% for shipboard effort.
- Spatial resolution was increased to 5km x 5km grid cells for all individual species and summary product layers, while the prediction units remain the number of animals/100km2. Individual species values are density.
- The color scheme for both individual species and summary products was changed from Viridis to Turbo. A summary of the differences and improvements with Turbo can be found here.
- For the first time, a towed passive acoustic monitoring survey (MCR SOTW Acoustical) was incorporated. This survey was used in models for sperm whales and beaked whales.
- The seal model is now included in the MDAT release.
- A new (non-stratified) density surface model for blue whale was generated and included in the summary product calculations for all relevant species groups.
- The new model extent/study area no longer includes the Laurentian Channel but now extends in the mid-Atlantic to include the Balanus Seamount and offshore of Blake Spur in the southeast. Additionally, the study area was extended further inshore in certain bays and estuaries, per NOAA’s request.
- The uncertainty methodology was updated and the resulting estimates now account for interannual variability. (Previous versions only accounted for the estimated statistical error in model parameter estimates.)
- Humpback whale model has been removed from ESA-listed species group, per NOAA declassification.
A complete accounting of the model version history, plus additional details on the individual species models and summary products can be found on the MDAT website. For specific details on the updates to each individual species model for marine mammals in U.S. Atlantic waters, see below and visit the Duke MGEL model repository page.
Reference:
Roberts J.J., Yack T.M., Halpin P.N. 2023. Marine mammal density models for the U.S. Navy Atlantic Fleet Training and Testing study area for the Phase IV Navy Marine Species Density Database. Document version 1.3. Report prepared for Naval Facilities Engineering Systems Command, Atlantic by the Duke University Marine Geospatial Ecology Lab, Durham, North Carolina.