")
The Northeast Ocean Data Portal’s interactive maps of commercial fishing vessel activity now show an additional two years of data through 2016 and are organized according to fishery management plans developed by the New England Fishery Management Council and the Mid-Atlantic Fishery Management Council.
The set of 33 maps broadly characterizes fishing vessel activity in seven fisheries in federal waters based on Vessel Monitoring System (VMS) data. The National Marine Fisheries Service describes VMS as “a satellite surveillance system primarily used to monitor the location and movement of commercial fishing vessels in the U.S.”
The updated data can be viewed on the Commercial Fishing theme map and on the Data Explorer map, which provides the option overlay data on other types of ocean uses and ecosystem characteristics.
For five fisheries—multispecies, monkfish, herring, scallop, and surfclam/ocean quahog—the updated maps display fishing vessel activity over a decade-long period beginning in 2006. The maps for the squid fishery show data for only years from 2014 to 2016. A series of maps called “pelagics” combines the herring, squid, and mackerel fisheries and also shows data for the years from 2014 to 2016.
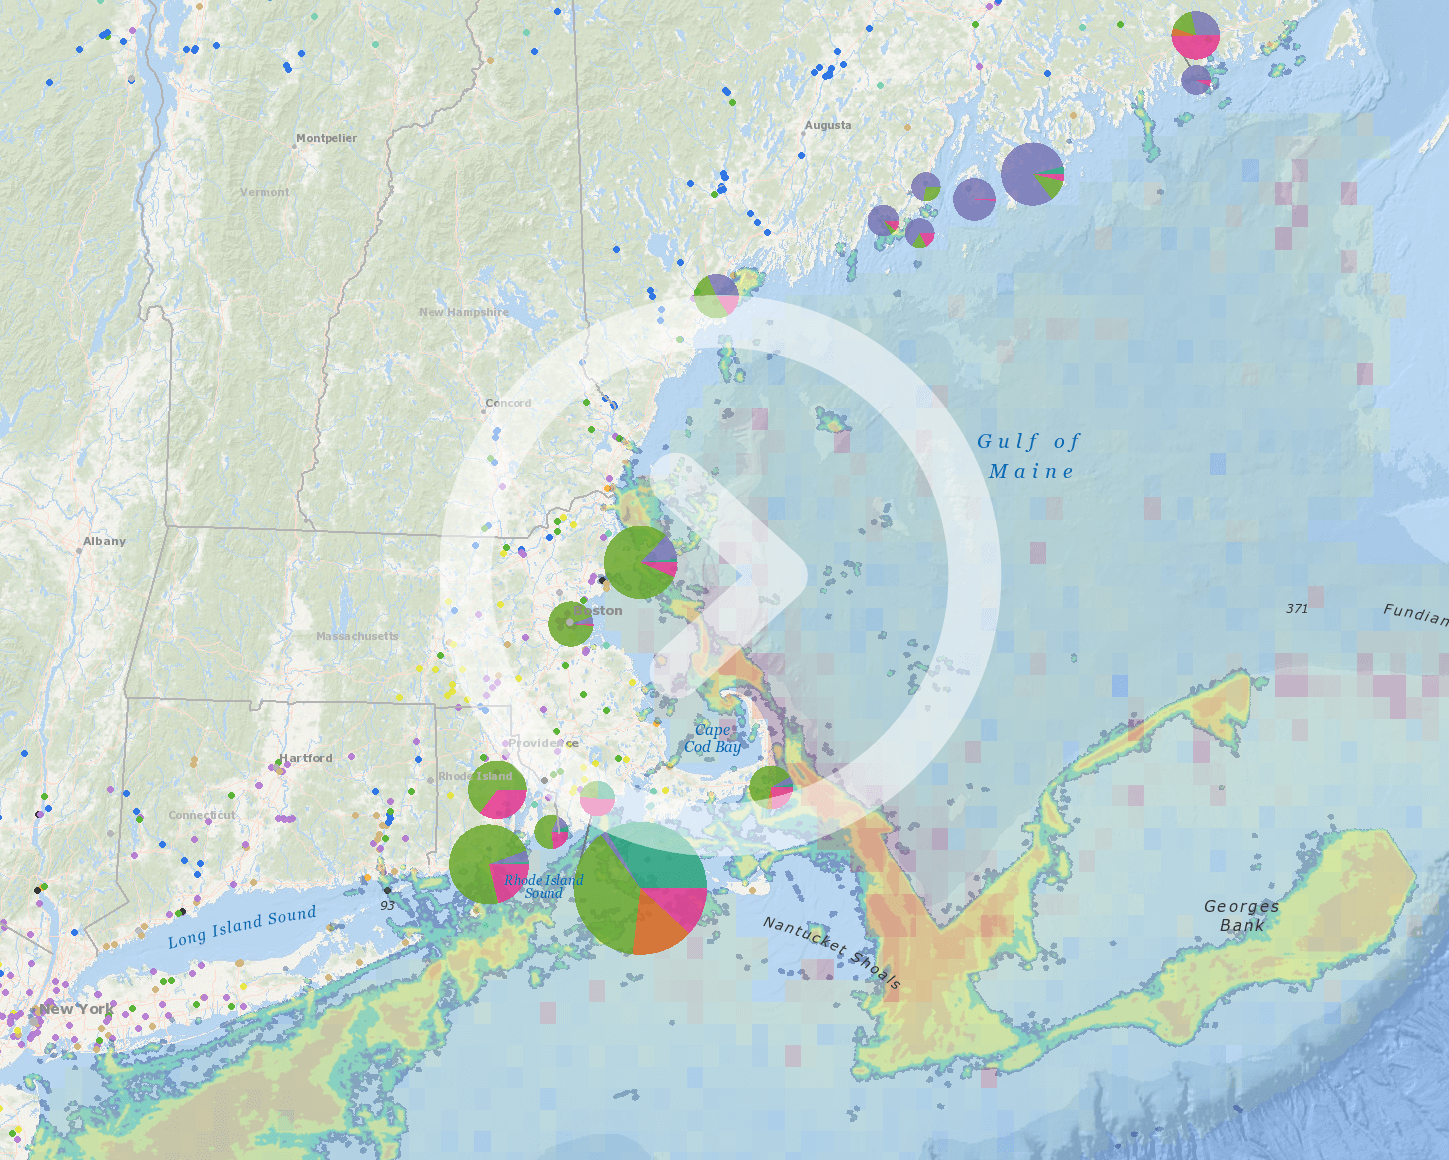
The limitations of the data should be understood prior to interpretation of these maps. The maps show relative vessel presence from low (blue) to very high (red) for each fishery, but do not indicate whether vessels were engaged in fishing versus other activities such as transit. Some maps show vessel activity at less than four or five knots—speed thresholds that were determined with industry input to attempt to better highlight places where fishing may have been occurring. Nevertheless, those maps still likely show some non-fishing activities that occur at low speeds, such as processing catch, sorting, drifting, or idling in port. For further information about the data and its limitations, please read the metadata.
Links to the interactive maps: