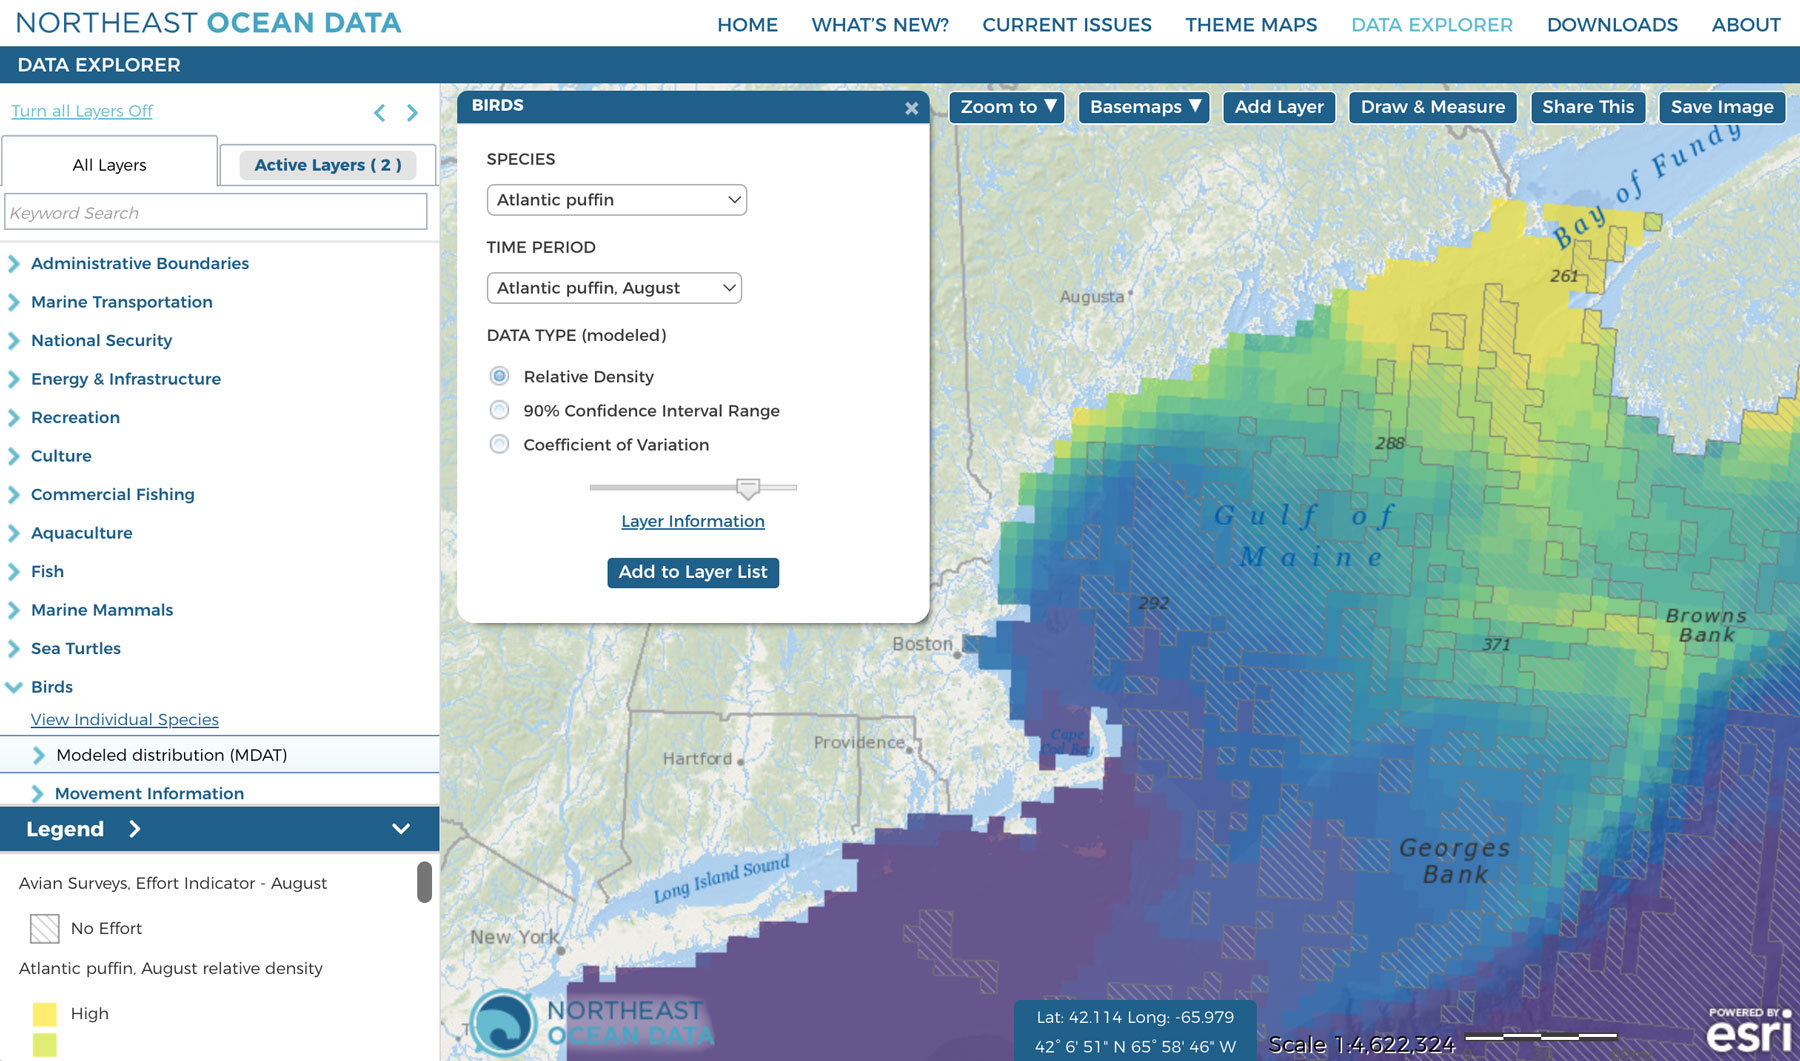
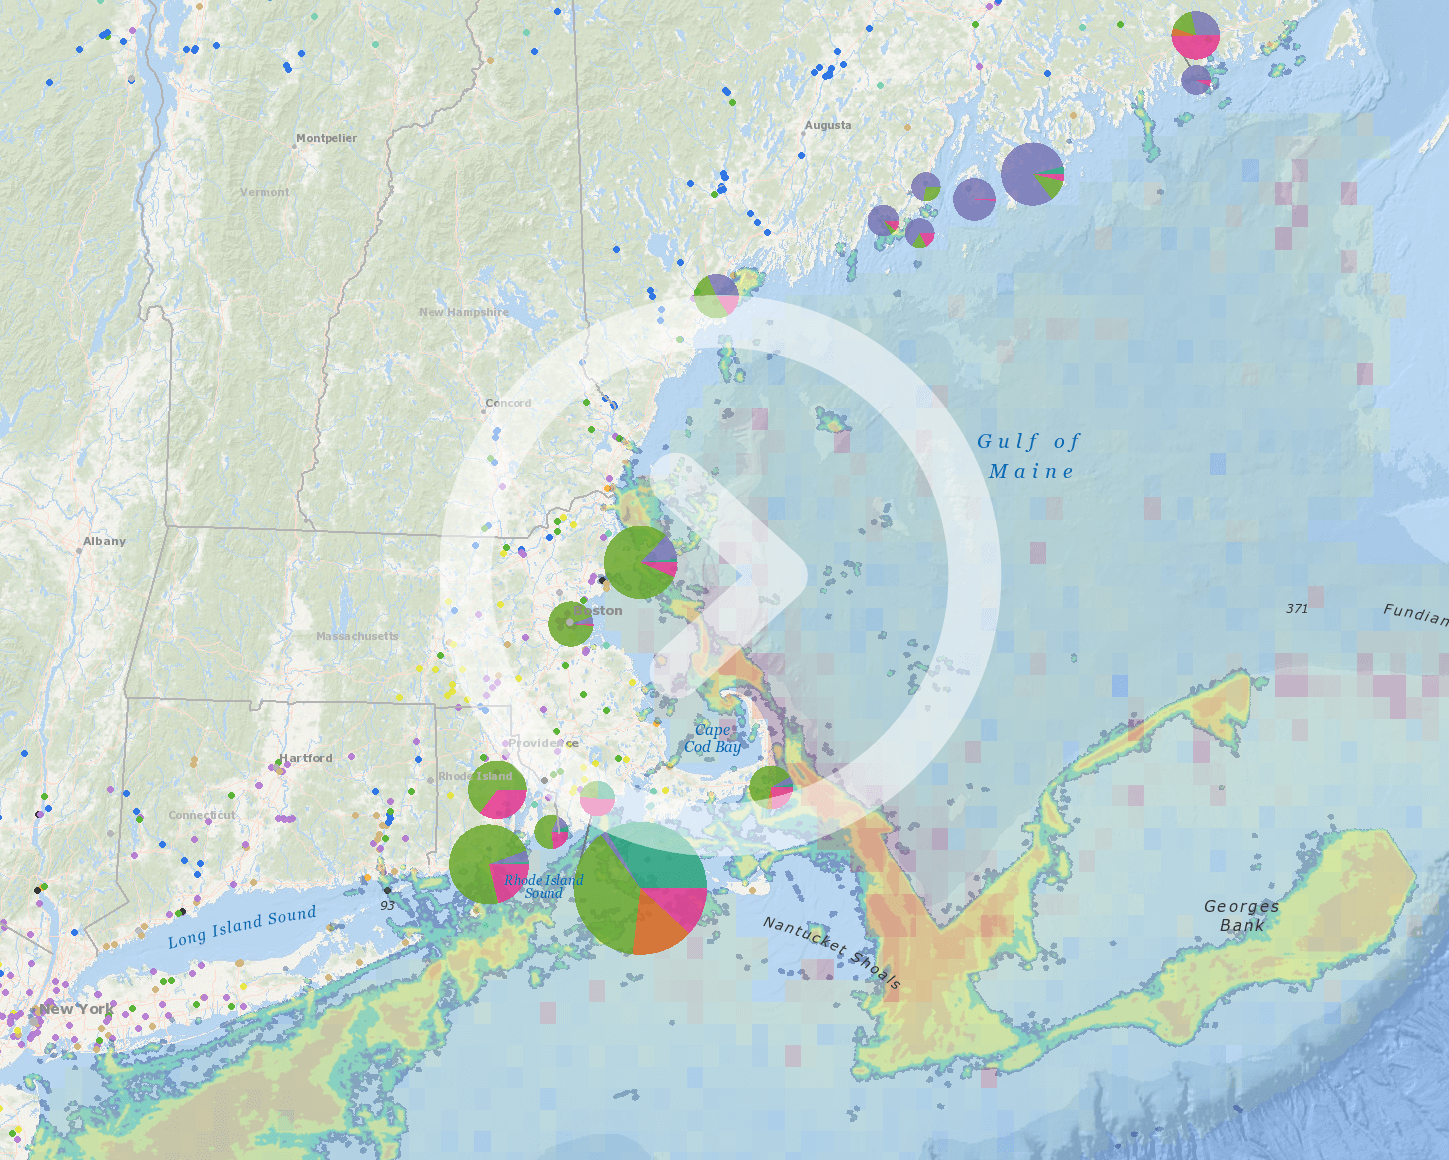
Through a collaboration with the Marine-life Data & Analysis Team (MDAT), the Northeast Ocean Data Portal and Mid-Atlantic Ocean Data Portal have updated their marine life libraries to include updated marine bird distribution model data products developed by the NOAA National Centers for Coastal Ocean Science (NCCOS), the Bureau of Ocean Energy Management (BOEM) and several other research institutions.
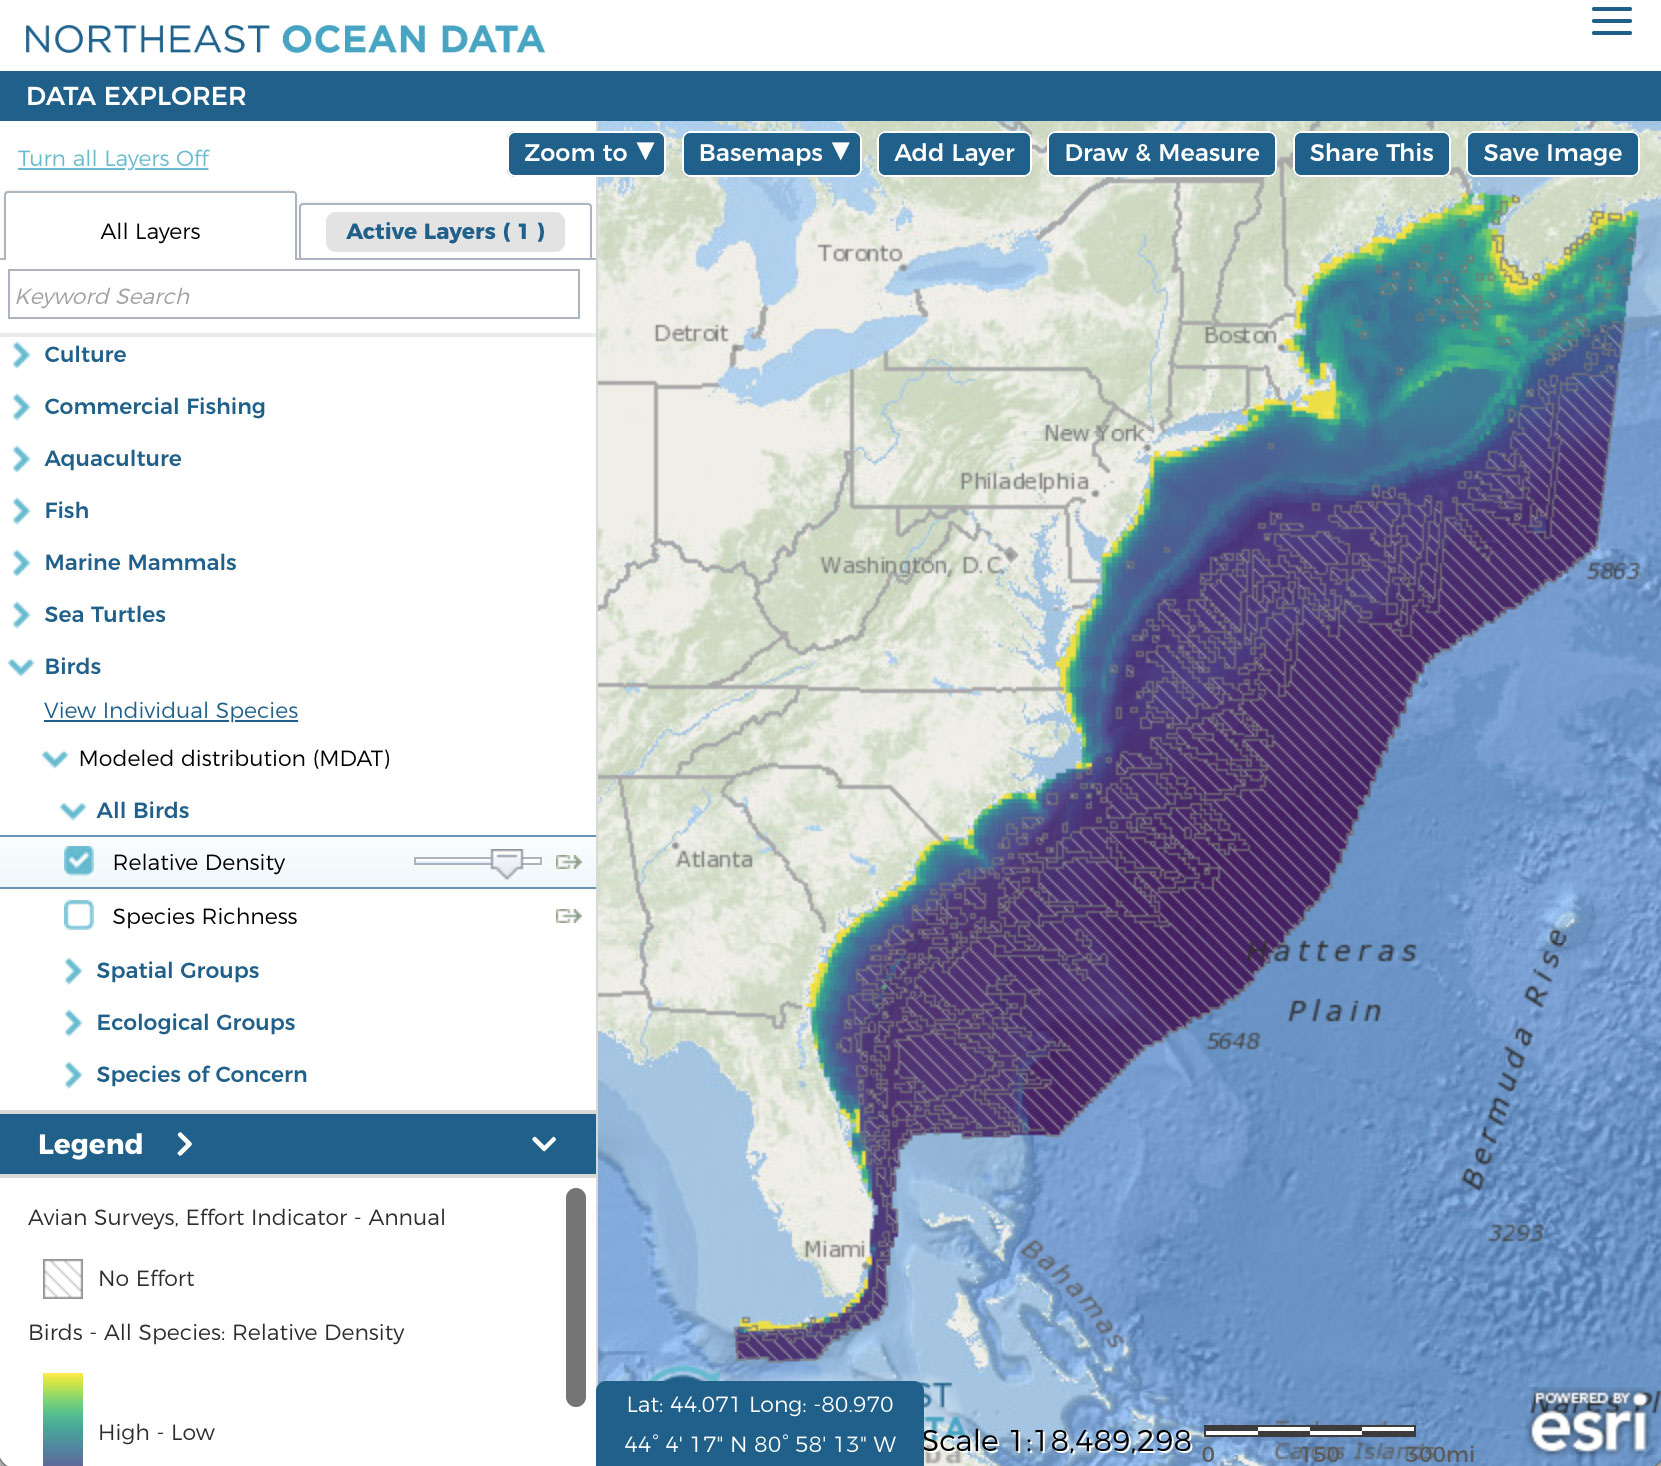
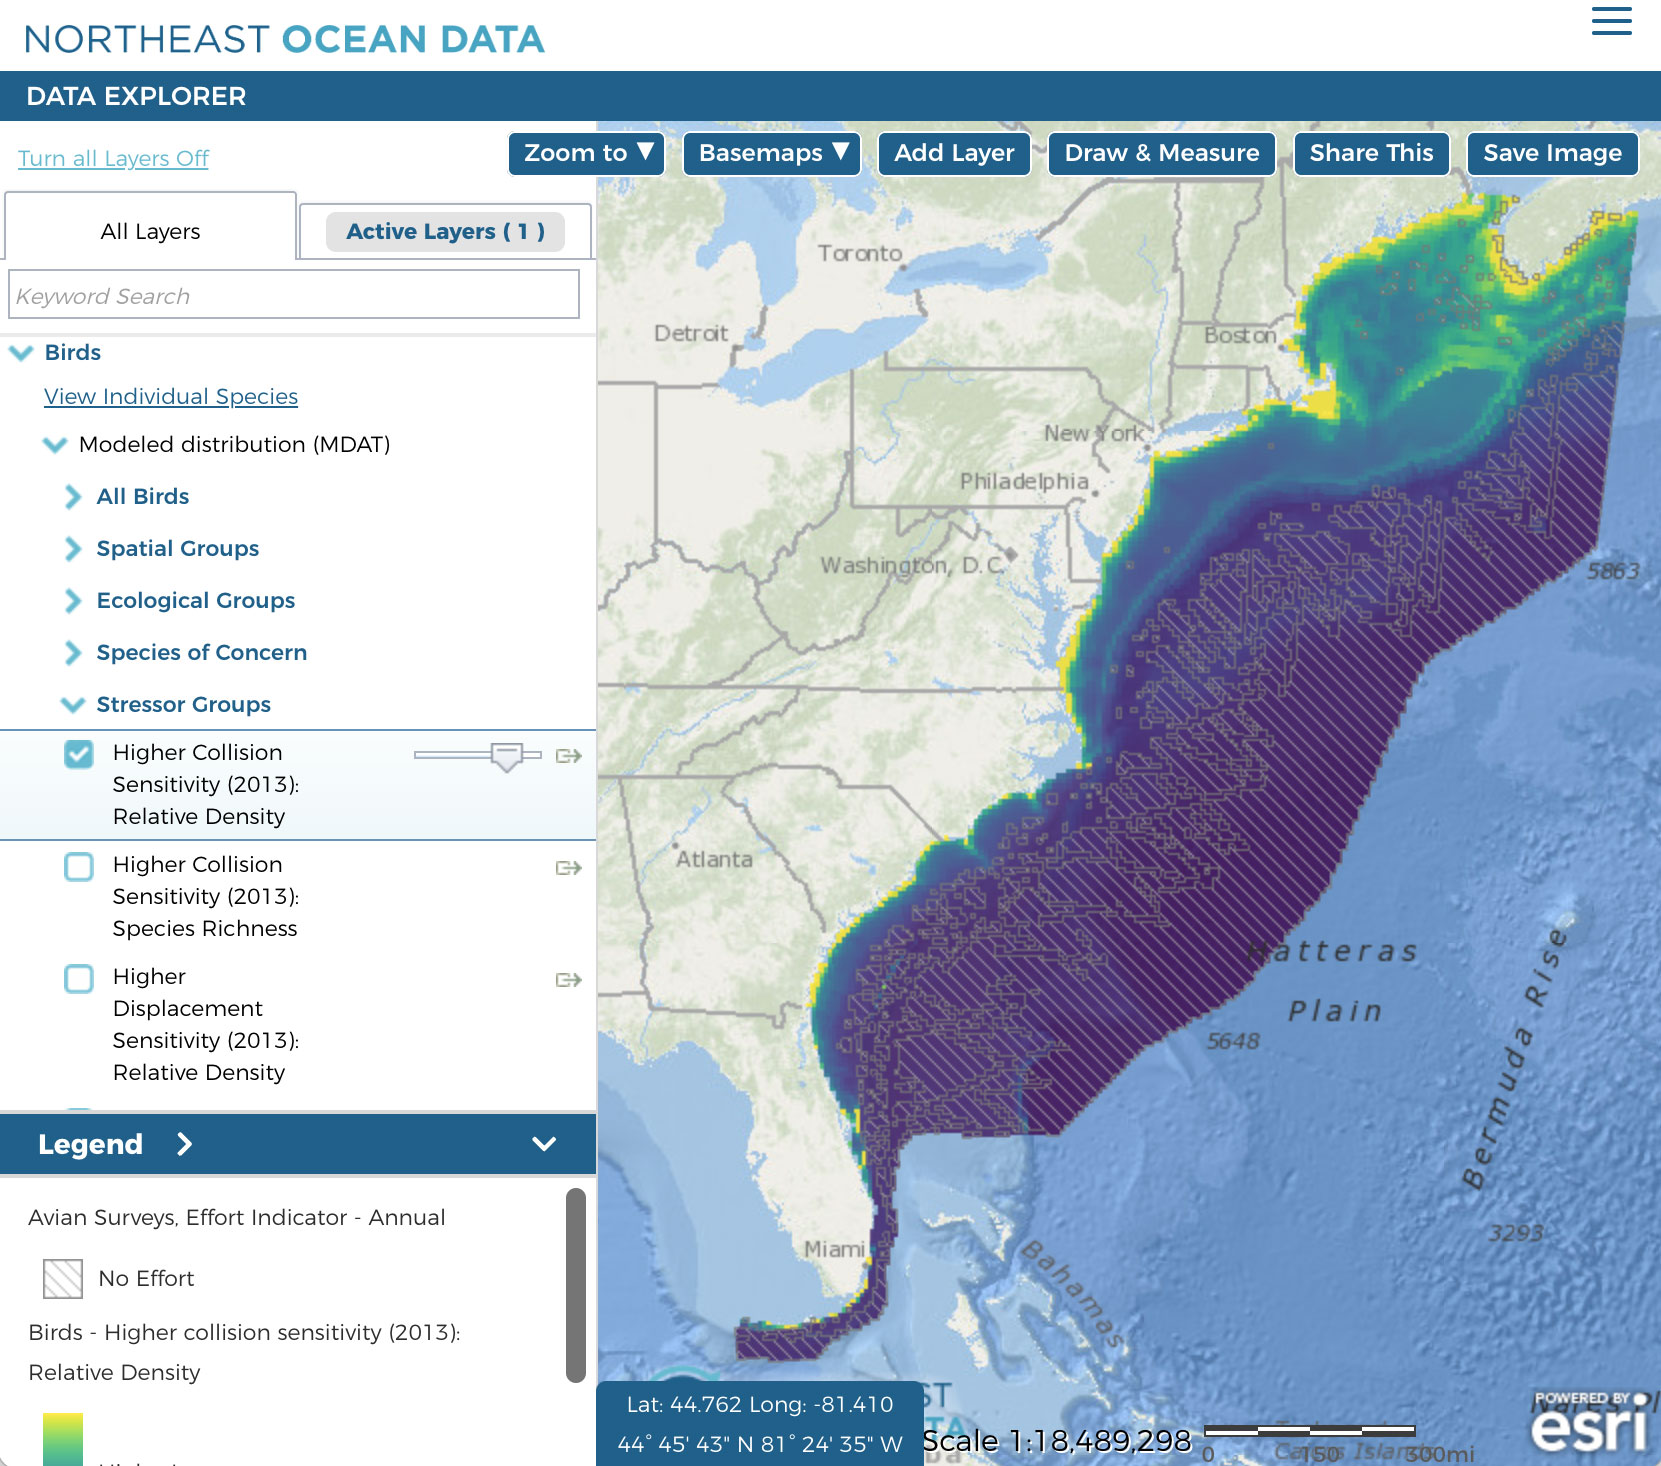
Whereas previous versions of the data products included seasonal estimates of relative density, the updated data products are monthly estimates. A total of 49 individual marine bird species were modeled. MDAT updated the existing marine bird species group products from these updated individual species models. Species group products include Spatial groups (e.g., nearshore species and offshore species), Ecological groups (e.g., surface plungers, benthic/bivalve eaters), Species of Concern (e.g., state-listed species), and Stressor groups (e.g., higher collision sensitivity).
To view the new data products, Northeast Ocean Data Portal users can navigate to the Birds theme map, or click on the “View Individual Species” link and “Modeled distribution (MDAT)” category within the Birds category in the Data Explorer table of contents.
The data products represent the first update to coastwide marine bird distribution models since 2018. For this recent modeling process, bird observation data between 1998 and 2020 were used to inform the models. The spatial resolution of the updated models is 10km x 10km, which is lower than the previous 2km x 2km resolution, to better match the spatial resolution of the environmental datasets that are used to help predict marine bird distributions. Uncertainty of the predictions was calculated from the coefficient of variation (CV) of a model bootstrapping process. The 90% confidence interval range is also provided as a measure of model uncertainty.
A technical report provides additional detail about the model inputs, methods, and results. The technical report also includes extensive tables displaying the proportion of predicted abundance of each species in BOEM wind energy planning areas and lease areas by month. The majority of species (41 out of 49) had <2% of their predicted abundance in BOEM lease areas on an annual basis. Common loon, White-winged scoter, and Long-tailed duck had the greatest proportional abundances in lease areas on an annual basis ranging from 2.9-4.1%.
The individual species models were reviewed by a group of experts convened by NCCOS and BOEM from government, academia, and the private sector. The species group products were reviewed by the RWSC Bird & Bat Subcommittee, with a focus on ensuring that individual species were assigned to the appropriate groups. This review resulted in discussions around a few particular species groups:
- The Atlantic Marine Bird Cooperative is currently in the process of updating its lists of species of conservation concern. The list that is currently available was developed in 2014 and is being used to populate the “AMBCC high conservation concern” species group within the Species of Concern category. These layers should be clearly marked with “2014” on the Portal and then should be updated using the latest species list from AMBC when it is available.
- Several experts noted that the “Higher Collision Sensitivity” and “Higher Displacement Sensitivity” groups were developed using the analysis within the BOEM report “The Relative Vulnerability of Migratory Bird Species to Offshore Wind Energy Projects on the Atlantic Outer Continental Shelf”, which was published in 2013. The RWSC Bird & Bat Subcommittee discussed a scope of work that could be implemented to obtain an updated and improved understanding of marine bird vulnerability around offshore wind development. MDAT will update these species groups according to any such future analysis. In the meantime, the layers on the Portal will be clearly marked with “2013”.
Additional Information:
- MDAT avian model repository
- Technical report: Winship AJ, Leirness JB, Coyne M, Howell J, Saba VS, and Christensen J. 2023. Modeling the distributions of marine birds at sea to inform planning of energy development on the US Atlantic Outer Continental Shelf. Sterling (VA): U.S. Department of the Interior, Bureau of Ocean Energy Management. 413 p. Report No.: OCS Study BOEM 2023-060. https://espis.boem.gov/Final%20Reports/BOEM_2023-060.pdf
- Avian individual species data product metadata
- Avian species group (summary) data product metadata
- Download the avian models and documentation


