Two new commercial fisheries datasets are now available in the Portal’s Commercial Fishing theme. Both datasets were developed and integrated into the Portal at the request of the commercial fishing industry and fishery managers on the Atlantic coast. Managers and industry participants also provided input on methods, visualization, and on how the data should be documented and communicated.
NOAA Fisheries “Fishing Footprints”

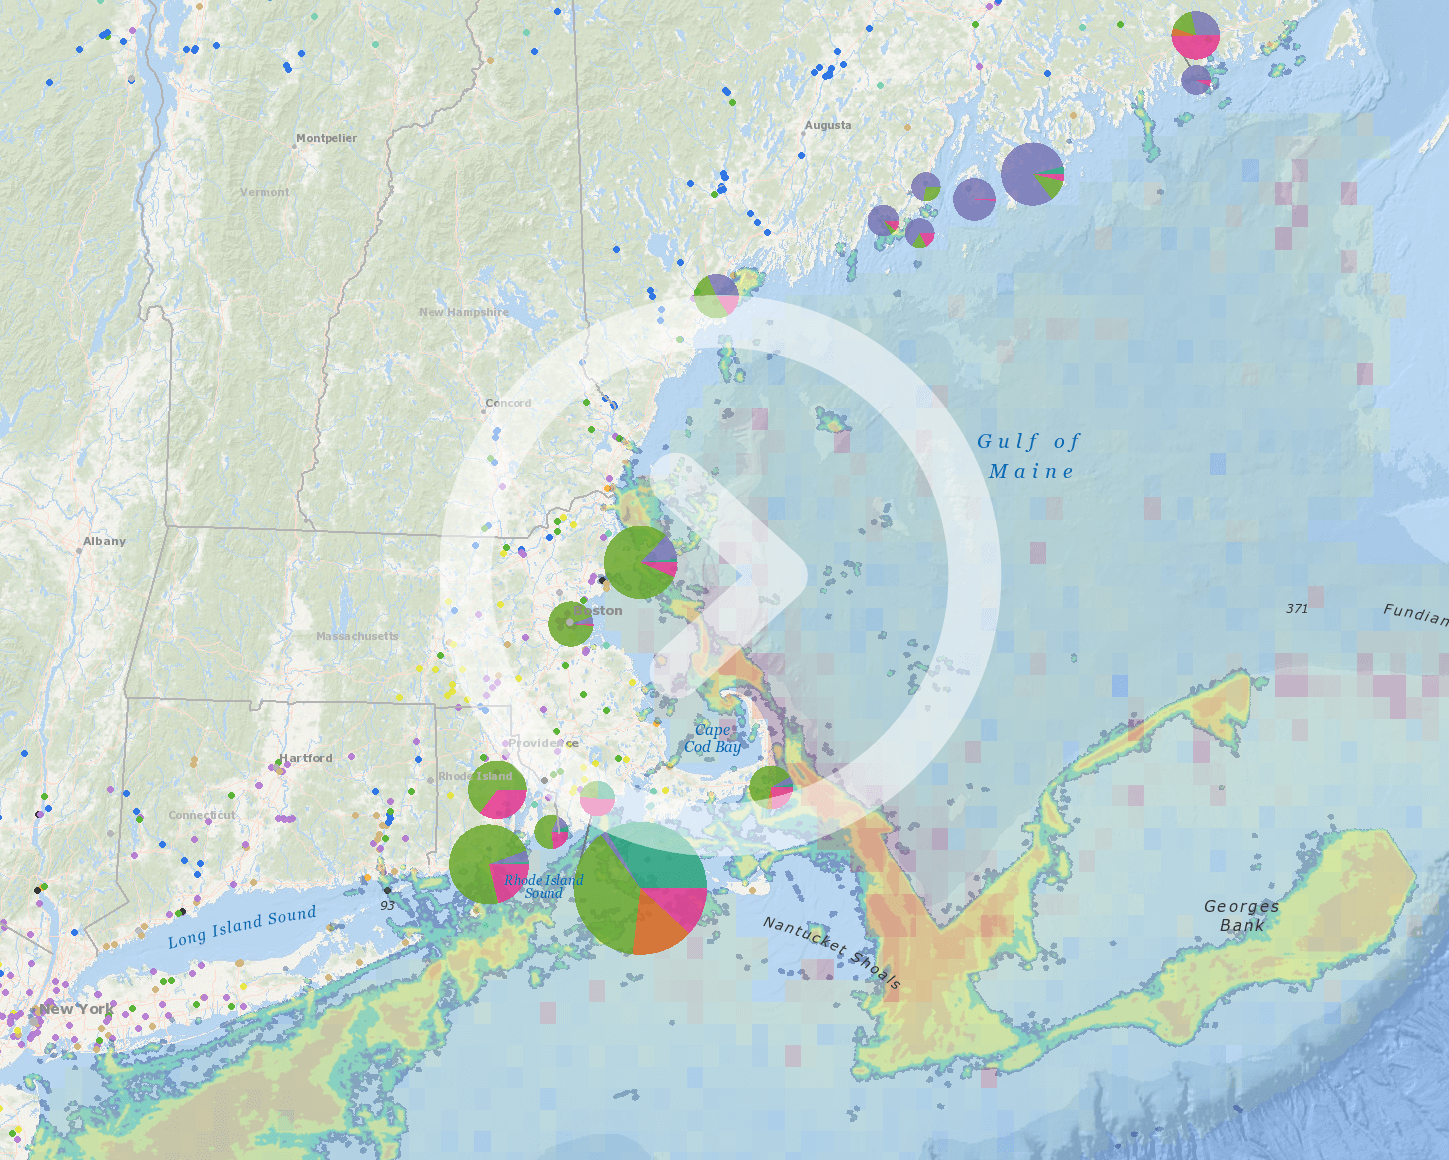
Screenshot of NOAA NEFSC Fishing Footprints map layer on Data Explorer showing sea scallop revenue from 2016-2020.
The first dataset, “Fishing Footprints,” developed and provided by NOAA’s Northeast Fisheries Science Center (NEFSC), shows commercial fishing activity organized by gear type and fishery management plan (FMP). Each gear type or FMP can be visualized as pounds of fish landed (landings) or the estimated value of those landings (revenue) for the periods from 2011-2015 and 2016-2020. Data provided comply with data confidentiality requirements under the Magnuson-Stevens Act through aggregation.
It is important to note that these public datasets have suppressed certain information due to confidentiality concerns and are meant to present general patterns of commercial fishing activity. To obtain the most accurate estimates of fishing activity, particularly in the case of offshore wind development, please see the region’s socioeconomic impacts page or contact NMFS.GAR.Data.Requests@noaa.gov.
To view these and other fishing data related to offshore wind planning and leasing, please visit this web page: https://www.fisheries.noaa.gov/resource/data/socioeconomic-impacts-atlantic-offshore-wind-development.
Approximately 100 Fishing Footprint maps were added in total. They can be found by clicking on any of the eight “NOAA NEFSC Fishing Footprints” dropdowns in the Commercial Fishing theme (Gear Type Landings 2011-2015 or 2016-2020; FMP Landings 2011-2015 or 2016-2020; Gear Type Revenue 2011-2015 or 2016-2020; FMP Revenue 2011-2015 or 2016-2020).
Vessel Monitoring System (VMS) “Transit Density”

Screenshot of a VMS transit map layer showing where vessels traveled at speeds of 6 knots of greater from 2016-2020.
The second dataset, “VMS Transit Density,” broadly characterizes the density of commercial fishing vessel transit activity from January 2015 through December 2019 for specific federally managed fisheries that require the use of VMS. VMS data were filtered at speeds suggested by commercial fishing industry representatives and fishery managers to potentially indicate areas of transit. The datasets for each VMS fishery uses two speed thresholds that are specific to the types of vessels and gear that may be in use. Importantly, there are likely to be other activities represented in these maps, including some fishing activity.
This dataset also suppresses certain information due to confidentiality concerns and to comply with confidentiality requirements. The layer information box for each map notes the percentage of activity that has been filtered due to confidentiality concerns and these percentages vary significantly by fishery. Therefore, a significant amount of vessel activity may not be included in some datasets.
The six map layers added are VMS Transit Density (>=5 knots), VMS Transit Density (>=6 knots), VMS Transit Density Multispecies/Monkfish (>4 knots), VMS Transit Density Multispecies/Monkfish (>5 knots), VMS Transit Gulf of Maine Density (>=5 knots), and VMS Transit Density Gulf of Maine (>=6 knots). These data can be found on the Data Explorer by clicking on Commercial Fishing and then Vessel Activity. VMS transit maps for additional fisheries will be made available on the Portal later this year.
The Northeast Regional Ocean Council (NROC) and the Mid-Atlantic Regional Council on the Ocean (MARCO) encourages users of these data to read all related documentation and to inquire with industry representatives or fishing management agencies to interpret and better understand how this information could be used.
NROC and MARCO continue to work with the commercial fishing industry and fishery managers to develop, update, and review the fishing data on the Portals. NROC and MARCO are currently scoping updates to the “Communities at Sea” data, the VMS derived data products, and new products characterizing recreational fishing activity. Please contact us for additional information or suggestions.
A Quick Guide to Our Fishing Data
The Portal houses thousands of map layers to capture the different aspects of commercial fishing activity in the region over time. Most of these maps fall within four categories, each of which depict fishing activity in their own useful but different ways.
Vessel Monitoring System (VMS): Show the areas where fishing vessels spent the most time based on electronic tracking data emitted by transponders. Maps display activity by fishery.
Communities at Sea/Vessel Trip Report (VTR): Depict the level of effort expended by workers in ocean areas by gear type. Users can also click these maps to learn which communities (ports) relied on specific areas at sea.
NOAA NEFSC Fishing Footprints: Present an economic view of fishing by depicting areas that yielded the greatest revenues and landings. Also based on VTR data collected from fishermen.
Fishery Management Areas: Current fishery management areas are provided as context for fishing patterns and to better understand current fisheries management. Users should be careful in drawing conclusions when using these maps with other commercial fishing products because fisheries management frequently changes and therefore time periods may differ.
Questions? Email contact@northeastoceandata.org